Purpose: Learn how to use a Tabular chart to get raw data for a set of tags for a specific grade over a given time span and then export it.
Task: Use Run Browser in a Tabular chart to view month-to-date raw data for a given grade, then export it.
Steps:
Build a Tabular Chart with tags from a grade-based process area.
On the Run Filter tab, select Multiple Runs for Process and Period as the time period source. The Location / Process Period Type and Filter Runs By sections will appear. Set the process are to the process area of the tags. If the selected process is grade-based, the Grade Filter section will also appear.
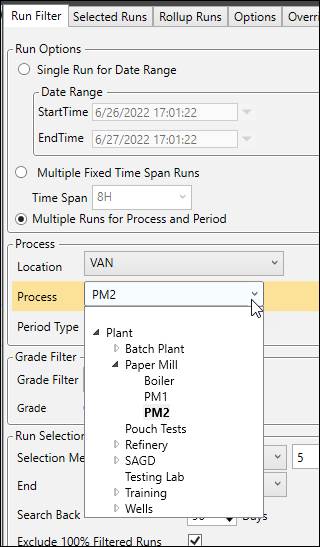
Set the Period Type to Grade.
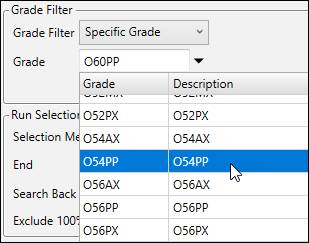
In the Grade Filter section, select “Specific Grade” and then choose a grade from the drop-down list.
Set the Run Selection method to Date Range. Use the calendars to set the Start and End. Choose a date range of two weeks.

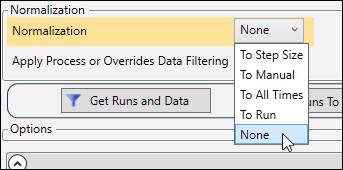
Set Normalization to “None” to retrieve raw data.
Click Get Runs and Data.

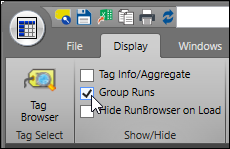
To Group data by run, on the Display tab check Group Runs.
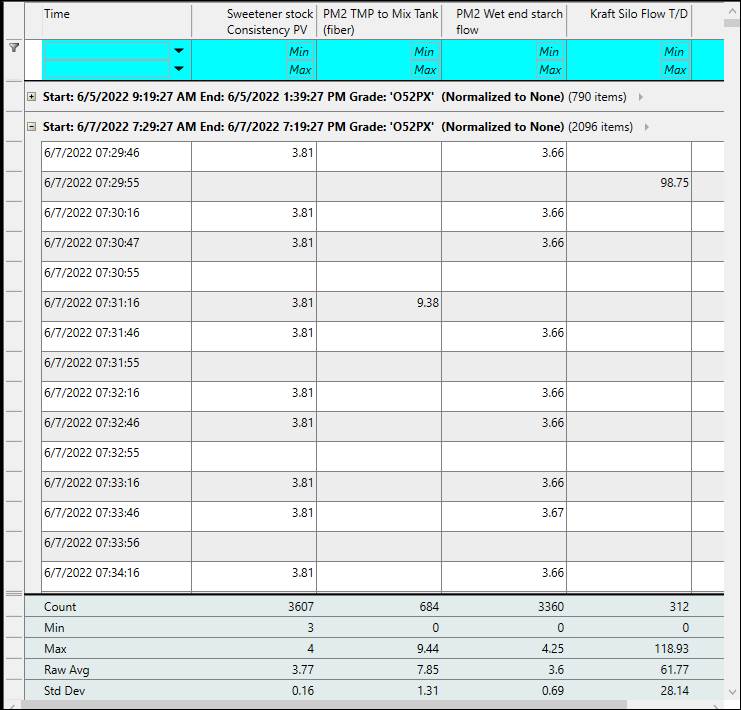
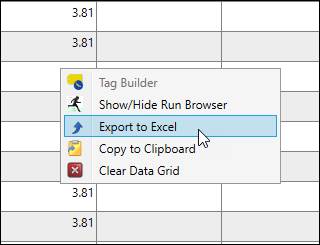
Right-click the grid, then select Export to Excel or Copy to Clipboard to make use of the data in other applications.
