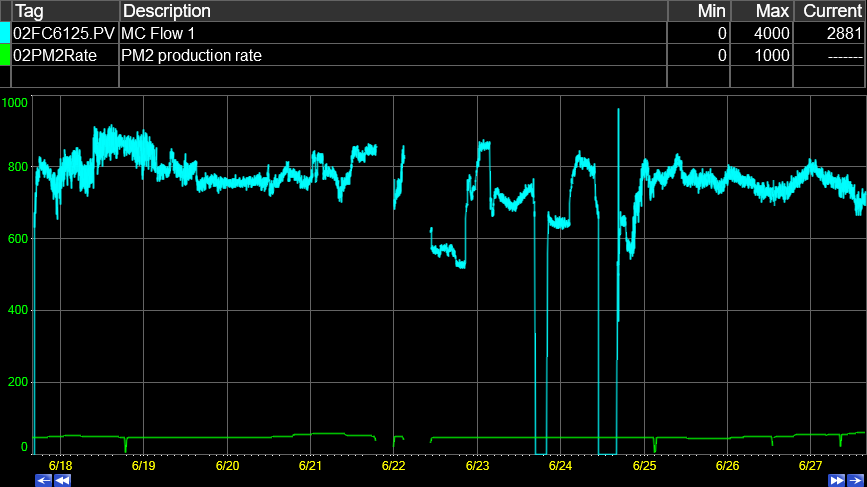
Purpose: Learn to use the Criteria grid to filter data over a timespan using tag values.
Task: Use the Trend’s Run Browser to filter data over a timespan for all tags in a trend using the Criteria grid. Add a tag and filter for when the tag’s values meet the specified condition, for example when the value is greater than zero.
Steps:
Create a Trend with at least one tag.
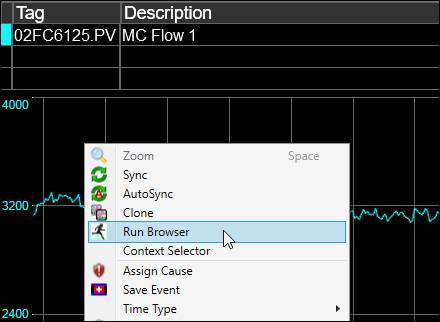
Right-click the plot area of the Trend and choose Run Browser.
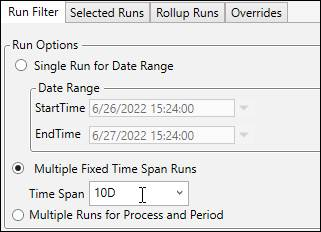
On the Run Filter tab, select Multiple Fixed Time Span Runs, then set the Time Span. Choose from the drop down, or enter a number followed by a time key letter (S = seconds, M = minutes, H = hours, D = days).
Set Filter Runs By to a Run Count of “1”.

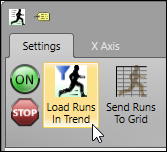
On the Settings ribbon, click Load Runs in Trend to preview the date range.
Next, expand the Criteria section. Open Tag Browser. Choose a tag to use as the data filter tag. This tag’s values will be used to determine when to filter out data for all tags in the Trend. It is helpful also to add the tag to the Trend.

Leave the Type as Filter. Select an Operator. This determines how that tag’s values will be compared to the specified value. In this example, the goal will be to filter for data when the tag’s values are greater than zero. In other words, this will remove all tag data when the filter tag’s value is zero or less.
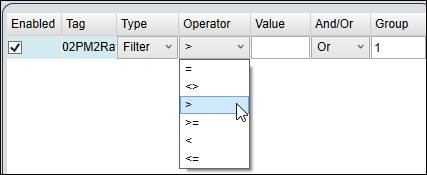
Enter “0” (zero) in the Value field.

Click Load Runs in Trend.
