Purpose: Learn to load multiple runs in a Histogram Chart for comparison.
Task: Open a Histogram chart by launching it from a Trend. Use the Run Browser to retrieve data for a give period type over a relative time window of 10 to 15 days ago. Filter values as needed.
Steps:
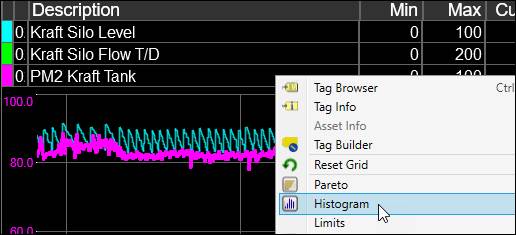
To create a Histogram from a Trend, right-click the a tag in the tag grid and choose Histogram.
Expand the Run Browser by clicking on the panel to the left.

On the Run Filter tab, select Multiple Runs for Process and Period as the time period source. The Location / Process Period Type and Filter Runs By sections will appear. Also, the Location and Process fields are pre-populated based on the properties of the first tag in the Histogram. If the selected process is grade-based, the Grade Filter section will also appear.
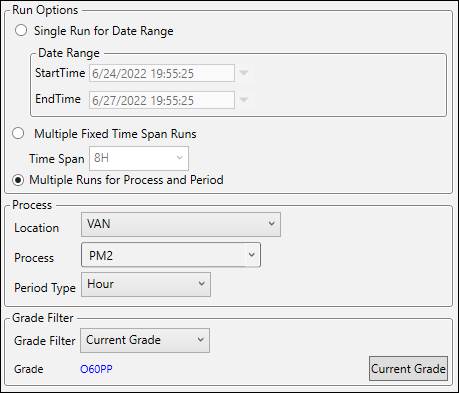
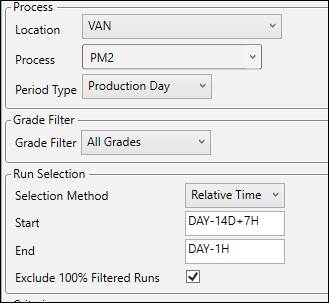
Set the Period Type to the desired type of run.
If the selected process area is grade-based, set the Grade Filter as desired.
Set Filter Runs By to “Relative Time”. Set the Start time to “DAY-14D+7H” (case sensitive) and the End time to “DAY-1H” (case sensitive).
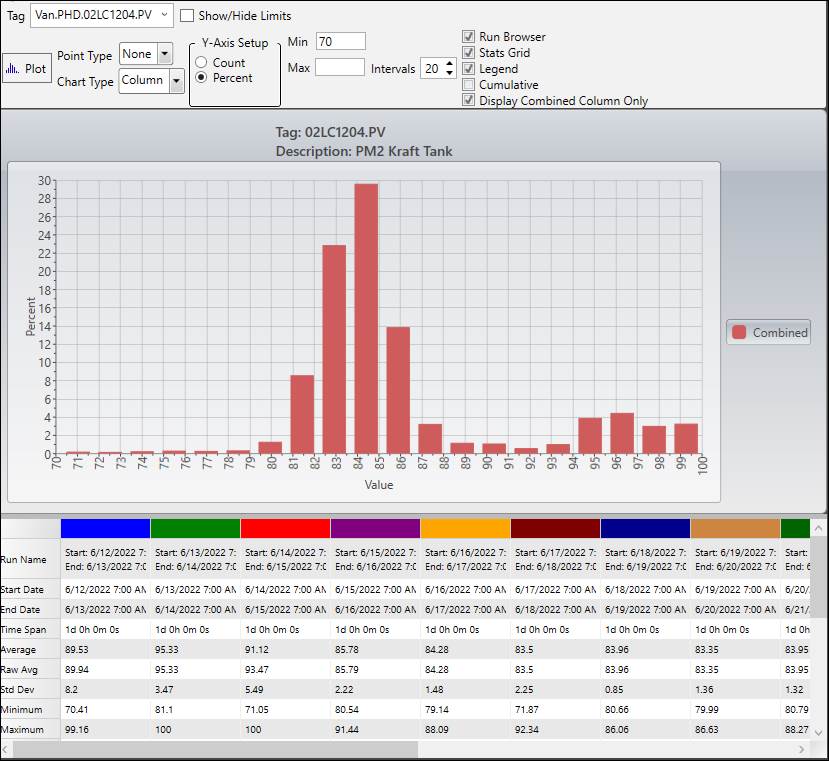
Click Plot. The Plot button turns green when there are new changes to be applied.

If necessary, use the Min and Max filter fields to exclude high and low values. Click Plot again after making changes.
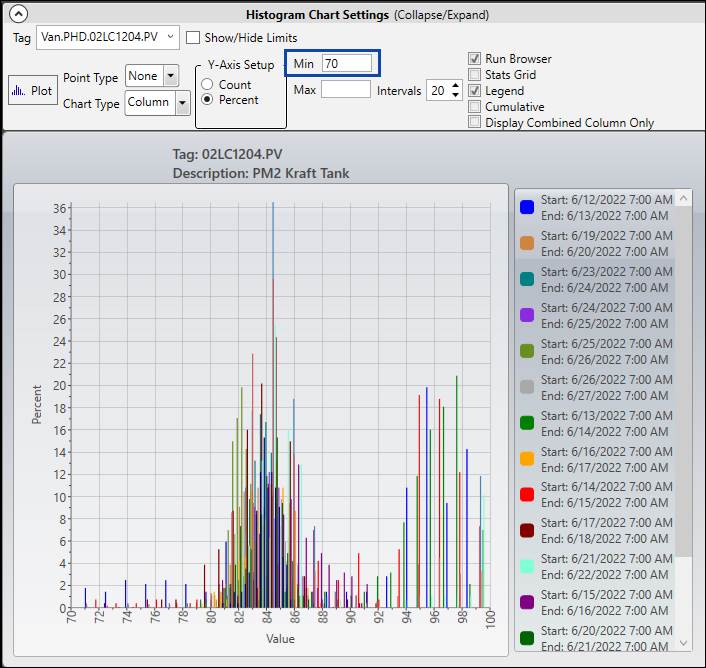
To see statistics for individual runs, check Stats Grid in the Histogram Chart Settings section. To see only the combined Histogram check Display Combined Column Only.
