Plot Data
- 01 Feb 2024
- Print
- PDF
Plot Data
- Updated on 01 Feb 2024
- Print
- PDF
Article summary
Did you find this summary helpful?
Thank you for your feedback
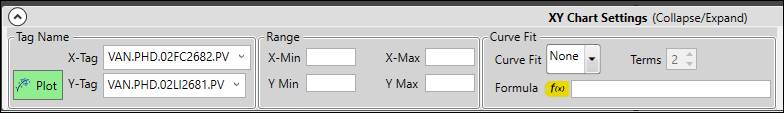
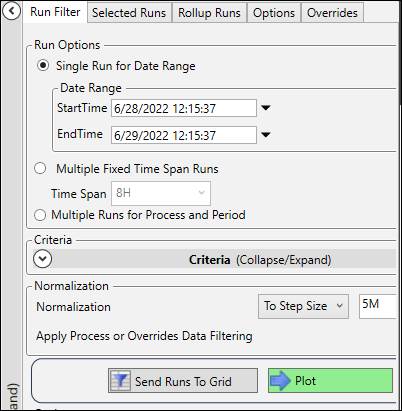
To show data on the chart, click the Plot button on either the X/Y Chart Settings panel or on Run Browser.
Was this article helpful?