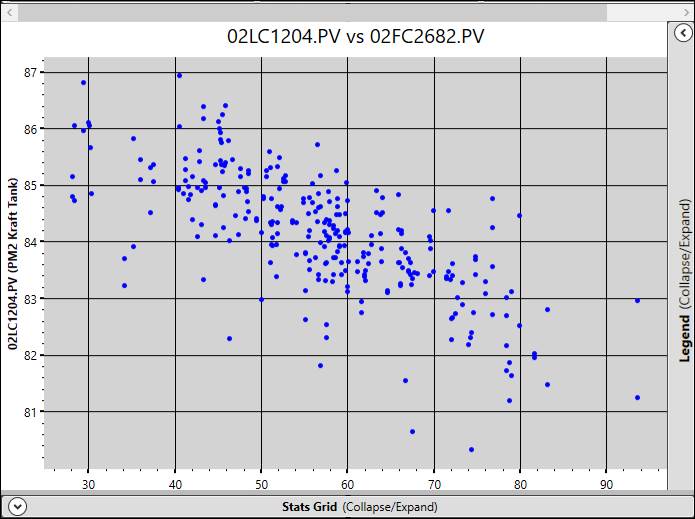
The plot area shows the scatter plot of the data. By default for new charts, the data shown is for the last 24 hours and is normalized to a step size of 5 minutes. Use Run Browser to change the timespan and normalization settings.
The plot area shows the scatter plot of the data. By default for new charts, the data shown is for the last 24 hours and is normalized to a step size of 5 minutes. Use Run Browser to change the timespan and normalization settings.