Purpose: Use Markers to find the change in time and tag value between two points in time.
Task: Right-click the plot area of the Trend and select Markers. Move the markers and view the marker data.
Steps:
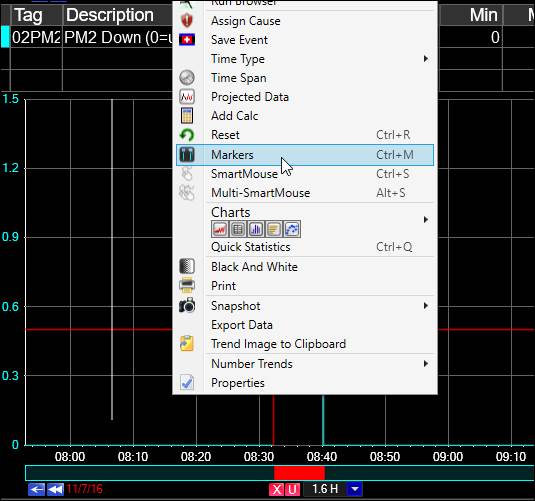
Right-click the plot area of the Trend and select Markers.
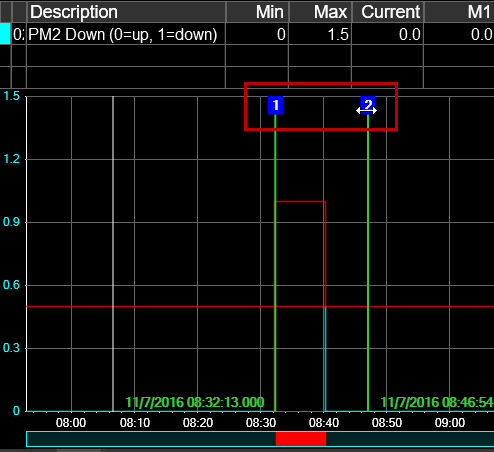
Click and drag the 1 and 2 buttons to move the Markers.
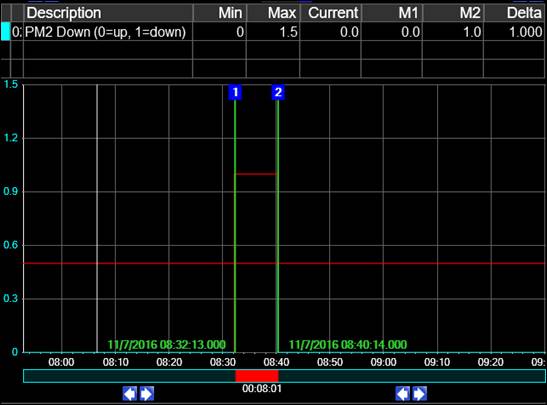
Additional tag grid columns show the values at the marker positions and the change in value between the markers. The time label in the middle of the bottom of the Trend is the time span between the two Markers.