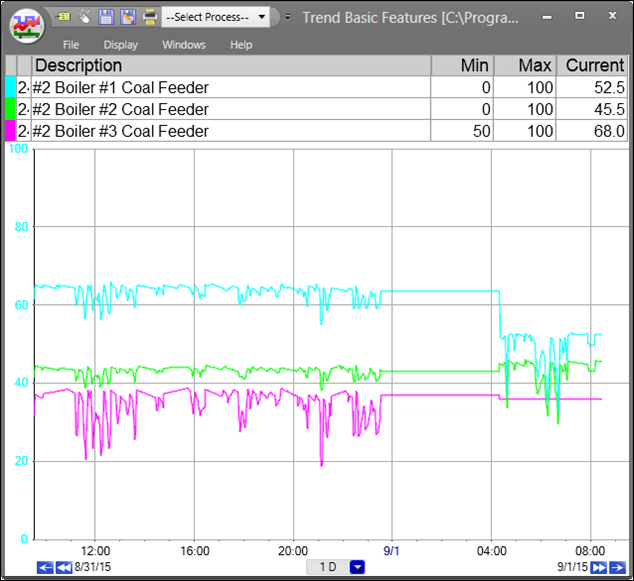
The Plot Area displays the trend lines in a time-based graph. The Y-axis can contain ranges for a single tag or for all the tags. The Y-axis color matches the color of the corresponding trend line. On the bottom of the plot is an X-axis showing times. Using the controls beneath the X-axis, a user can pan forward and backwards in time. These controls and axis labels can be hidden using the Trend Config properties.
Click and drag on the plot area to highlight a slice of time. This is used when zooming or saving manual alarm events.
Tag Highlight
Select a tag in the tag info grid to highlight its trend line on the plot area.
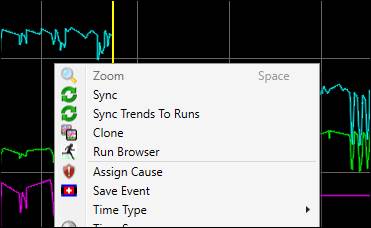
Plot Area Right-Click Menu
Right-click the plot area of a trend to open the context menu.
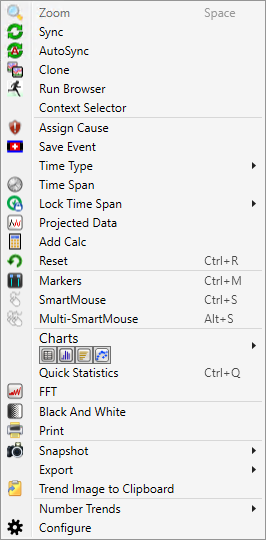
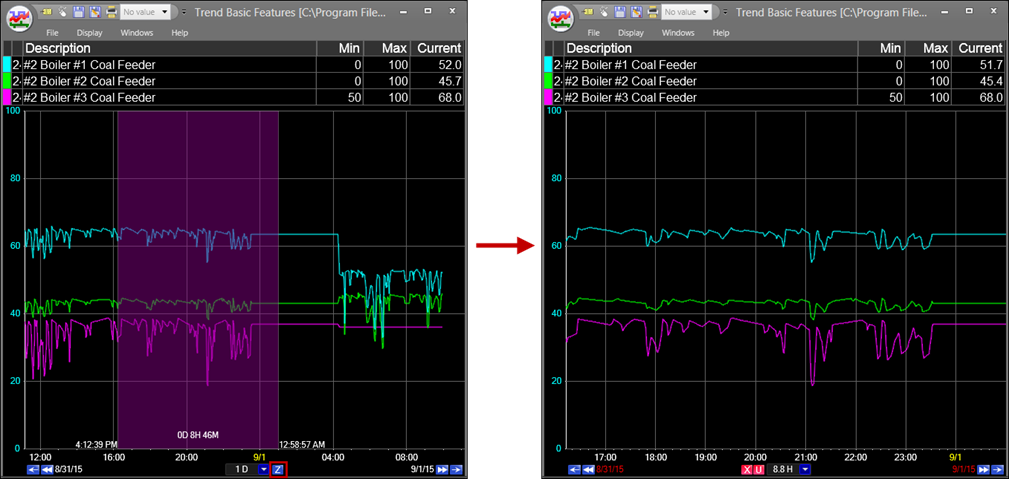
Zoom: To zoom in on a specific time period, select the region by clicking on start time and dragging to an end time or vice versa. After selecting the region, click the ![]() button or the zoom button in the right-click menu. The mouse’s scroll wheel can also be used to zoom in and out from the cursor’s position. Zoom is disabled when markers are on.
button or the zoom button in the right-click menu. The mouse’s scroll wheel can also be used to zoom in and out from the cursor’s position. Zoom is disabled when markers are on.
Sync: Synchronizes all trends in the multi-trend to the timespan of the selected trend.
AutoSync: Toggles all trends to automatically sync to the same timespan when any timespan in the multi-trend is changed. Note: if the trend is in run mode this option is replace with Sync Trends To Runs, see below.
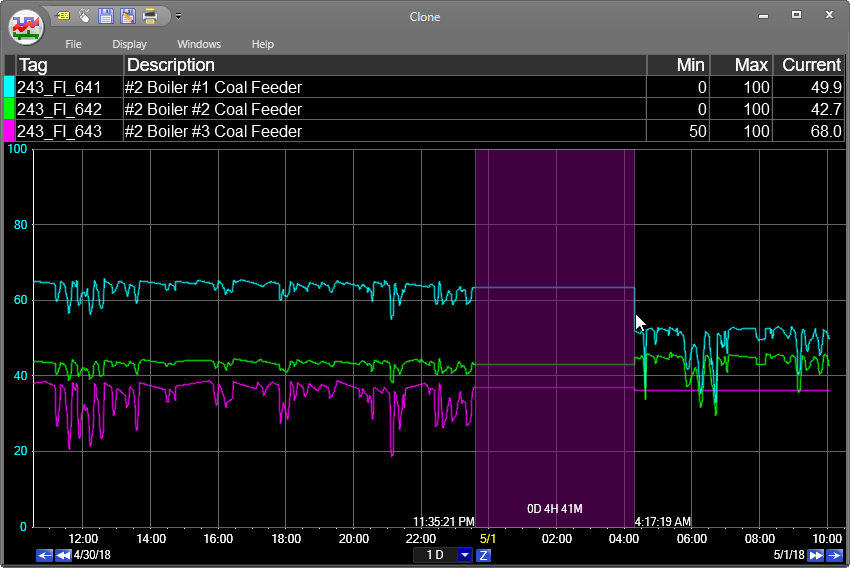
Clone: Creates a popup trend display of the chosen trend.
Run Browser: Opens the Run Browser.
Asset Selector: Opens Asset Selector where a process or asset context can be selected.
Assign Cause: Opens the Assign Cause window.
Save Event: Manually creates an event in the database. Applied to highlighted timespan.
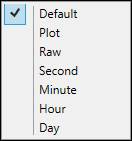
Time Type: Changing the time type of a trend forces all tags to show the selected type of data. Default uses whatever Aggregates is currently applied (/PLOT, /TAVG, etc.). The Plot setting forces plot reduction for all tags. The Raw setting displays every data point for all tags. Second, Minute, Hour, and Day take the time-weighted average over the given interval and plot the point at the start of the interval, aligned to the beginning of the second, minute, hour, or day.
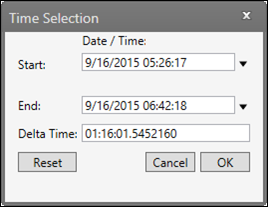
Time Span: Opens a window that allows exact timespan entry. Either enter an absolute start time and end time or a delta time. The delta time section adds the amount of time entered to the start date to find an end date.
Lock Time Span: Sets the start and end times of the trend so that if the trend is saved with is setting, when it opens it uses the set times instead of showing the default timespan relative to the current time. This option is tied to the Absolute Start and Absolute End properties in Trend Configuration.
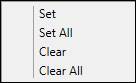
Set: Set absolute start and end times for the trend.
Set All: Set absolute start and end times for all trends in a multi-trend.
Clear: Clear absolute start and end times for the trend.
Clear All: Clear absolute start and end times for all trends in a multi-trend.
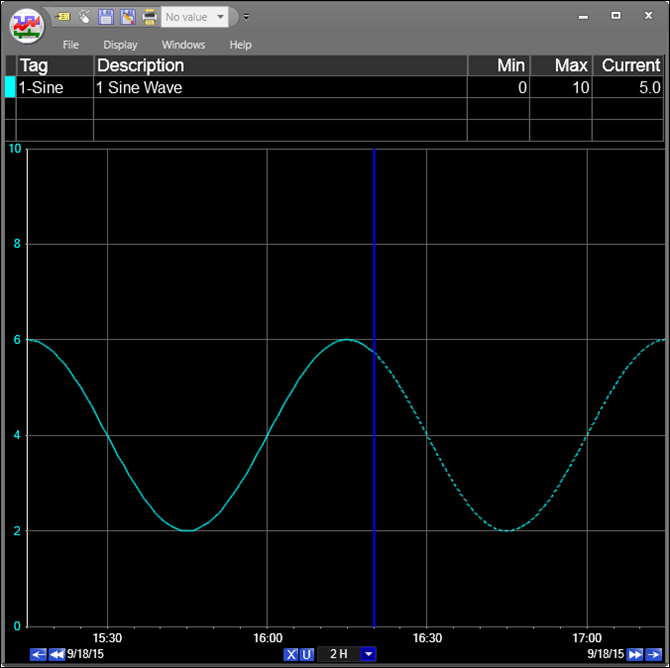
Projected Data: Shows projected data for the future. The current data and the projected data are separated by a blue vertical line. The projected data is shown in a dashed trend line. Projected data only works if the source has been configured to have projected data in System Configuration.
Add Calc: Opens the Script Editor with the first tag in the trend as the base tag.
Reset: Reloads the entire Trend Display back to its last-saved state.
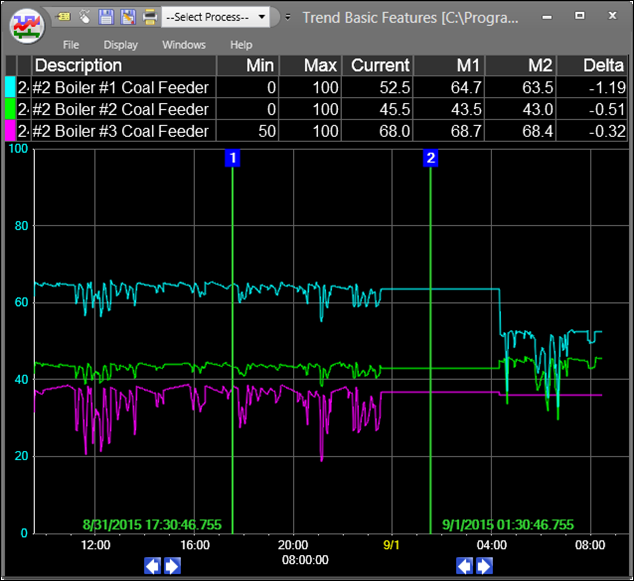
Markers: Toggles two vertical markers showing specific values and time-based differences.
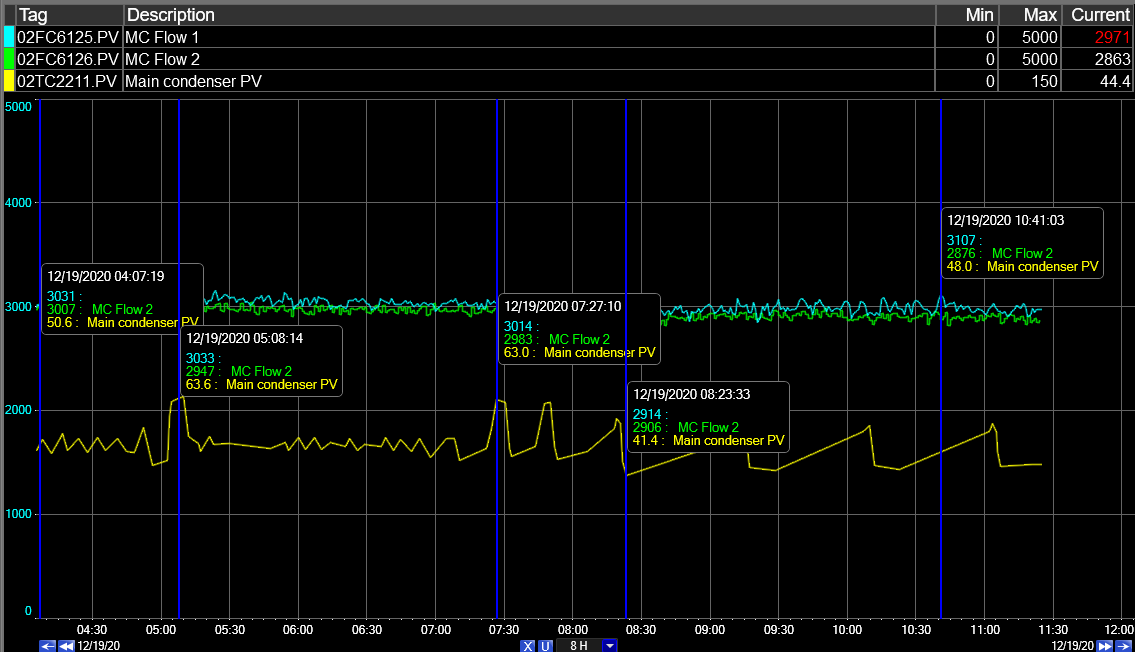
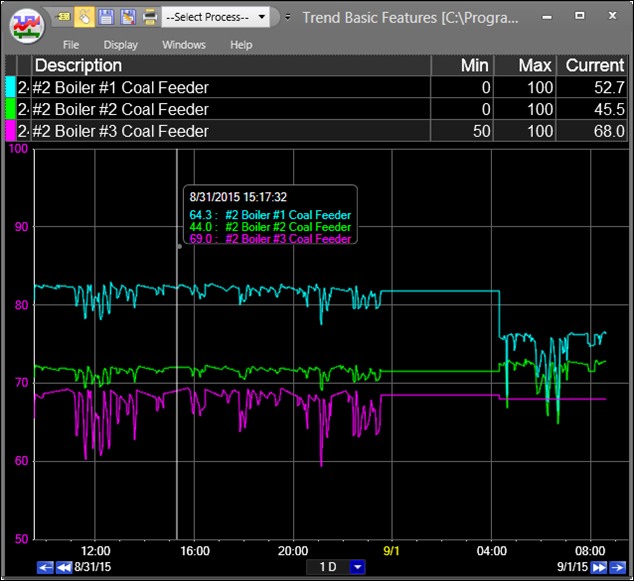
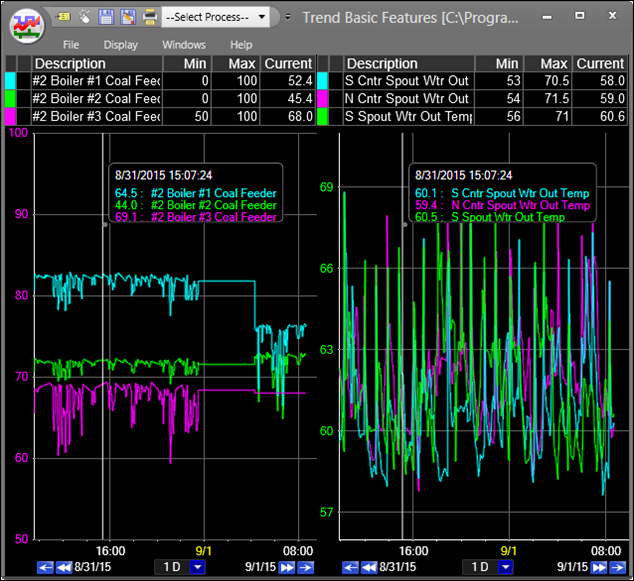
SmartMouse: Toggles SmartMouse. SmartMouse shows the value for all the tags at the cursor position. A box appears displaying the timestamp, value, tag description, and any active limits for each tag in the Trend. The colors of the information match the colors of the trend lines. A vertical line at the timestamp appears in all trends in the multi-trend for visual comparison.
Multi- Smart Mouse: Toggles Multi-SmartMouse. Multi-SmartMouse works in the same was SmartMouse, but it shows the values for the timestamp in all of the trends in the multi-trend.
Charts: Multiple charts can be opened from the plot area. Clicking on a chart button opens a chart using all of the tags in the trend.
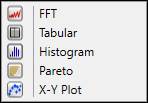
Tabular: Opens a Tabular Chart Chart.
Histogram: Opens a Histogram Chart Chart.
Pareto: Opens a Pareto Chart.
X-Y Plot: Opens an X/Y Chart chart.
Quick Statistics: Toggles the statistics grid for the selected trend. Column visibility can be toggled in Tag Info Grid Properties. Each row in the Quick Statistics Grid contains information for a single tag.
Note: Quick Statistics are most likely calculated from a plot-reduced set of data and should therefore only be treated as approximations of actual statistics.
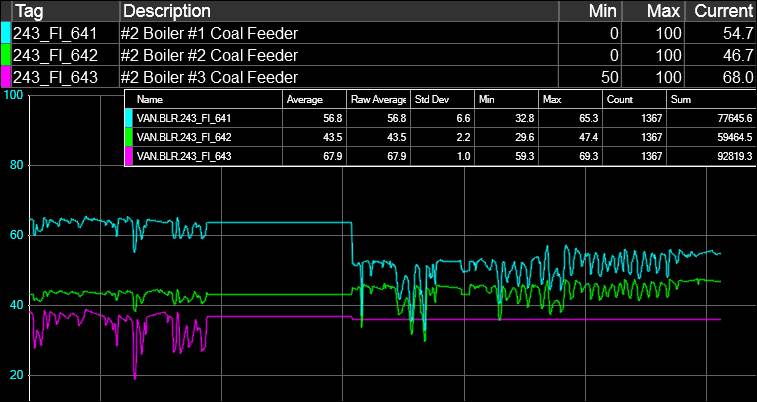
Color: The color of the tag’s trend line.
Name: Short name of the tag.
Avg: The time-weighted average over the timespan.
Raw Avg: The raw average over the timespan.
Std Dev: The standard deviation of the tag’s values.
Min: The lowest value within the timespan.
Max: The highest value within the timespan.
Count: The number of data points within the timespan.
Sum: The sum of all the data points in the timespan. This column is toggled using the Sum setting in the Tag Info Grid Properties.
Fast Fourier Transform (FFT): Changes the trend from time-based to frequency-based for finding cycles in data. See FFT Trend.
B & W: Inverts black and white colors in the trend.
Print: Opens Print dialog. Toggles B&W before printing. (Tip: to actually print in black, first toggle B&W and then print).
Snapshot: Capture and interact with data while offline.
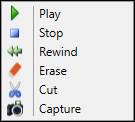
Play: In playback mode, only the captured data is displayed.
Stop: Exit playback mode.
Rewind: Reset the Trend’s timespan to the total span of the captured data.
Erase: Removes the Snapshot captured data from the Trend file.
Cut: If a slice of time is highlighted, this option removes the data in that span from the captured data.
Capture: Saves all of the tag data known to the Trend in the Trend file.
Export: Choose to export data to the clipboard or a tabular chart (Export Data) or to export data to a file.
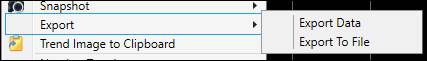
Export Data: Opens an export data dialog that allows users to choose normalization methods and where to export data: Clipboard or Tabular Chart.
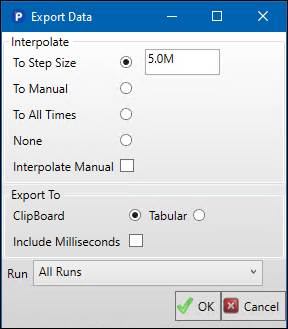
To Step Size: Selecting To Step Size and entering a timespan in the text boxnormalizes data to a specific time interval. The timespan must be a factor of seconds (S), minutes (M), hours (H), or days (D). Only values at the timestamps selected by the time interval are read, and no averaging occurs.
To Manual: The trend reads the list of timestamps defined for the first tag in the tag set whose interpolation type is manual. Then it interpolates the values of the remaining tags to these timestamps. This setting is useful when comparing a manual-type tag with continuous-type process data tags. If no manual-type tags are detected, the first tag in the list is treated as the manual tag.
To All Times: Retrieves data from all available timestamps. If Interpolate Manual is not checked, any tag whose interpolation type is manual will not have its values interpolated, and only shows a value at timestamps that have a raw value. If it is checked, manual-type tags have their values interpolated to all available timestamps.
None: Retrieves all available data with no normalization.
Export to Clipboard: Copies the tag names, descriptions, values and timestamps to the clipboard, from where it can be pasted into other programs, like Microsoft Excel.
Export to Tabular: Creates a Tabular Chart Chart display with the Trend’s tags and timespan and the specified interpolation setting preloaded.
Include milliseconds: Shows millisecond values on the timestamps in the exported data.
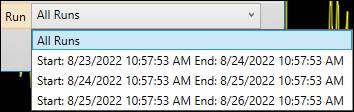
Run: If the trend contains multiple runs, choose to export data from all runs or select an individual run.
Export to File: Opens an export to file dialog, where users can choose the format of the text file and resampling methods.
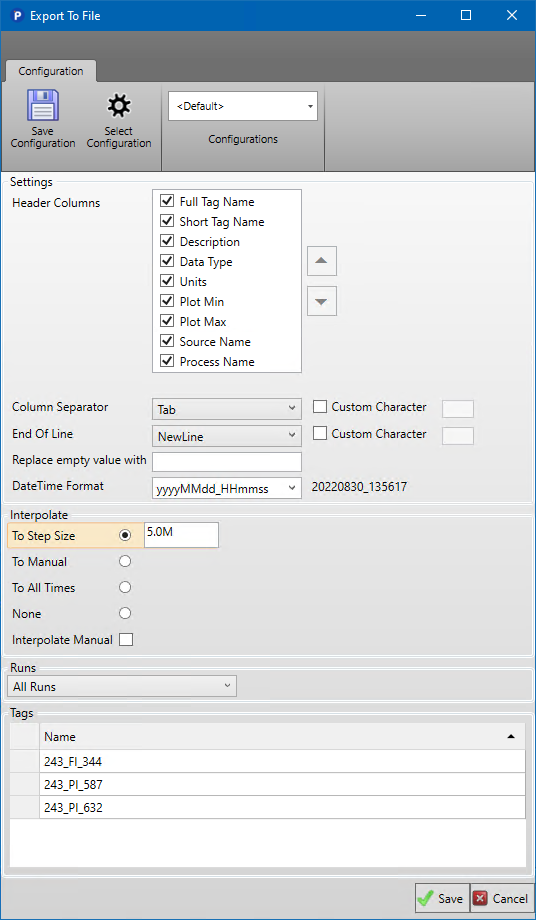
Save Configuration: Save the current configuration to the database. Users can give the configuration a name, description, and owner.
Select Configuration: Select from a filterable list of saved configurations.
Configurations: Shows the currently selected configuration. Users can switch the selected configuration here, including resetting to the default configuration.
Header Columns: Select the header column information to include in the export. Each tag has its own column in the text file.
Column Separator: Select the character used to separate column. To use a custom character, check the box then enter the character.
End of Line: Select the end of line character. To use a custom character, check the box then enter the character.
Replace Empty Value with: Enter text to replace when there is no value at the selected timestamp for a tag. If blank, the output will also be blank.
DateTime Format: Specify the datetime format of the output. The default uses the client PC’s culture setting. A sample output of the current time.
Interpolate:
To Step Size: Will normalize to the step, with units, supplied in the box. Units are formatted as they are in trends: M for minutes, S for seconds, etc.
To Manual: Will normalize all tags to the first manual tag in the Trend. If no tags are set to manual interpolation, it will use the first tag in the Trend.
To All Times:Will normalize to all available timestamps of all tags except for manual tags.
None: No normalization.
Interpolate Manual: If checked, it will calculate interpolated values for manual tags.
Runs: If the source trend is in run mode, select from the available runs or export data for all runs.
Tags: Lists the tags that will be in the exported file.
Save: Save the text file. The file type defaults to .txt when using tab or semicolon column separators and .csv when using comma column separators.
Cancel: Close the window without exporting data.
Trend Image to Clipboard: Captures an image of the trend and copies it to the Clipboard.
Number Trends: Use this feature to create a MultiTrend. Either select the number of subtrends from the list on the left or “draw” the footprint of the MultiTrend.
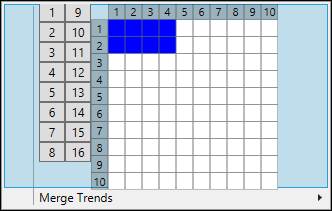
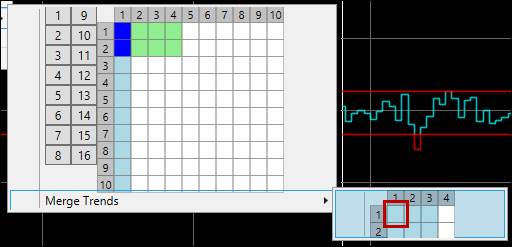
Merge Trend: Combines trends into a larger trend. Only the tags from the upper left trend remain in the merged trend. The first trend selected is the trend that is merged into a larger trend using trends down and to the right of its position. This is used to create subtrends of different sizes within a MultiTrend.
Configure: Opens the Trend Properties window on the Trend Config tab.
Run Mode Option
When a Trend is in run mode, the AutoSync option is replaced with Sync Trends to Runs. See Run Browser for more information on enabling run mode.
Sync Trends to Runs: Synchronizes all trends in the multi-trend to the run set of the selected trend.
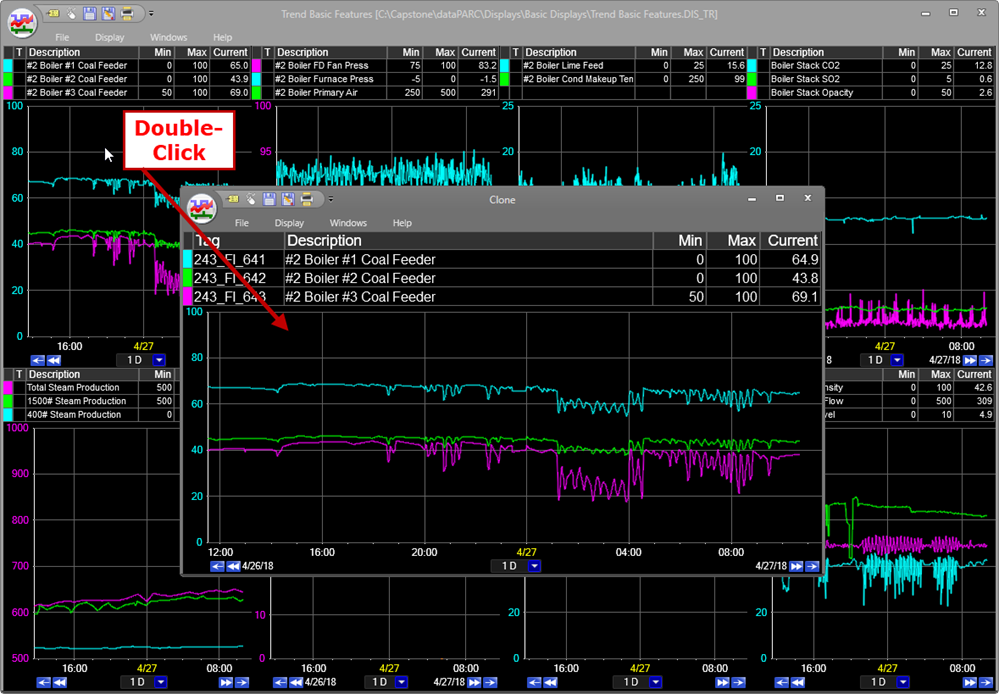
Clone Trend
Double-click the plot area of a trend to “clone” a trend. Cloned trends are topmost so that tags from other displays can be dragged onto the popup trend without losing sight of the window.
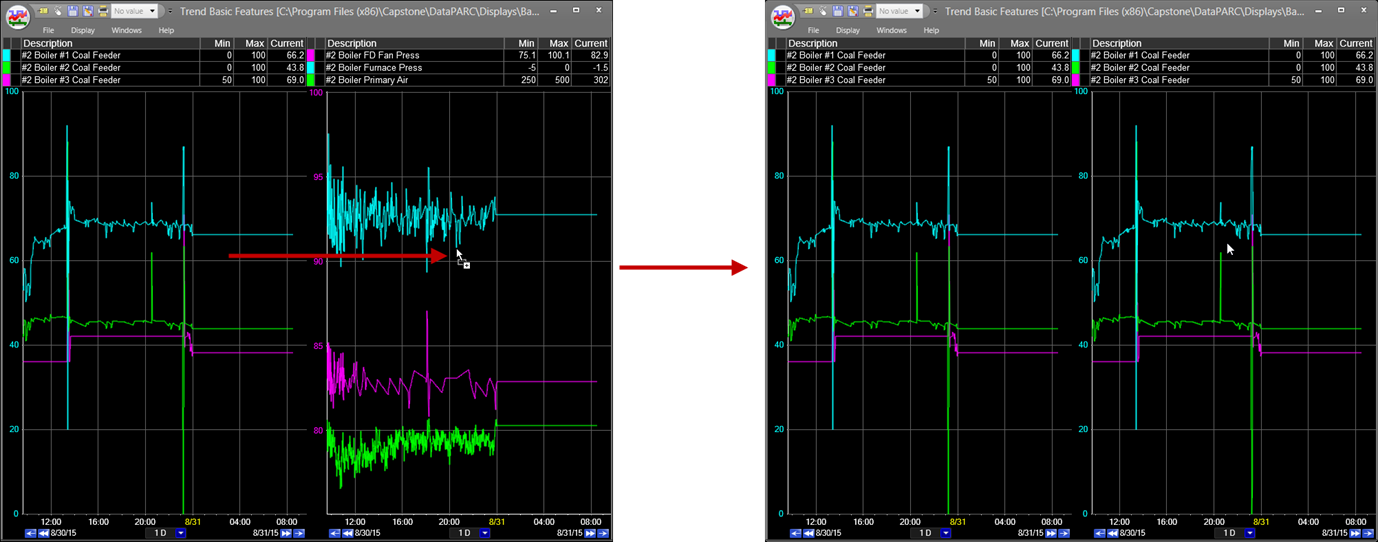
Copy Trend
Hold down the CTRL key and drag and drop a trend onto another trend to copy the trend and all of its properties.
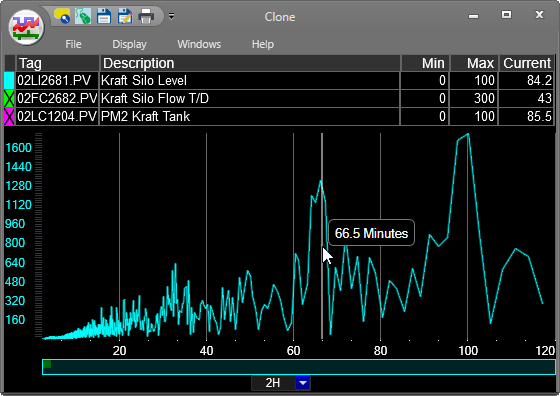
FFT Trend
Set the period length of the FFT by changing the time span. Zoom with the scroll wheel or click/drag + spacebar.
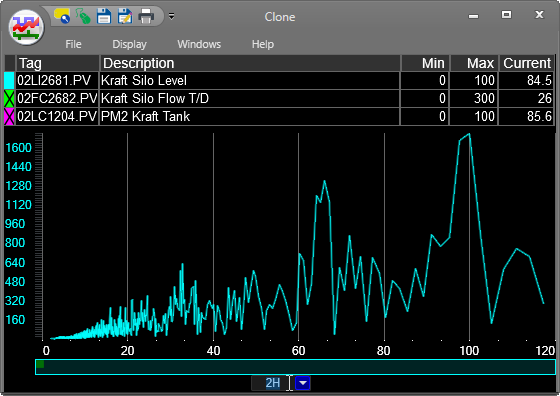
SmartMouse shows the time into the period.
In a multitrend, the sync option will turn other trends into FFT trends with the same period.
SmartMouse Pins
Hold the SHIFT key and click to pin the SmartMouse window to the plot area. The blue vertical line indicates the time of the data shown. Click the arrow button on the window to toggle its appearance to the left or right of the time line. If the timespan of the Trend is changed, any SmartMouse windows pinned to the plot area will remain aligned to their respective timestamps, even if they are no longer visible.
When MultiSmartMouse is enabled, windows will only be pinned to the trend under the cursor, not all trends at once.
To remove SmartMouse pins, click the "x" button on the window. Alternatively, hold SHIFT and press X to clear all SmartMouse pins from the active trend.
SmartMouse pins do not persist if the display is closed then reopened.