Purpose: Learn to apply filtering in a normalized data sheet and to change interpolation types.
Task: Add tags to a normalized data sheet. Select a tag to use as the filter tag. Change the interpolation type of the tag to “Min” and then filter all rows where the minimum value is less than a specified value.
Steps:
Create a new normalized data sheet and add several tags.
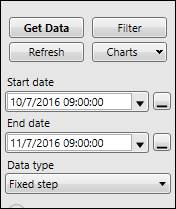
In the dataPARC panel on the left, set the Start date and End date to be roughly the last month, rounded down to the nearest hour.
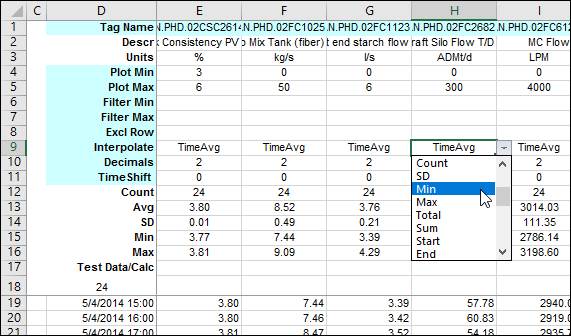
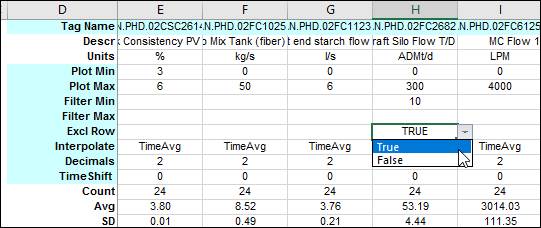
Find the column with the filter tag.
Change its Interpolate type (row 9) to Min.
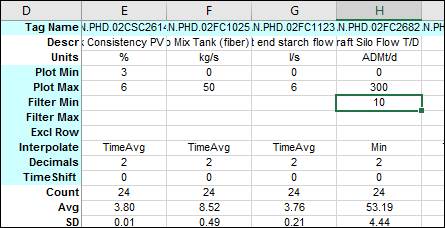
In the Filter Min row (row 6), enter the value to use as the filter.
Set the Excl Row (Exclude all Rows setting in Row 8) to True.
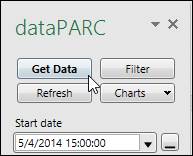
Click the Get Data button.
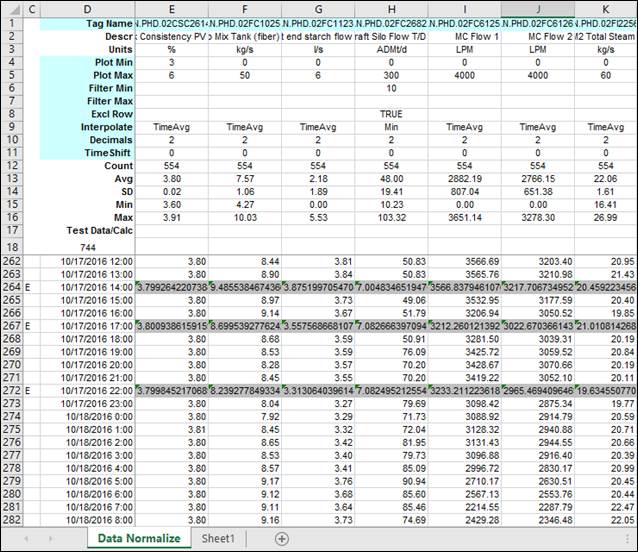
Excluded rows are highlighted in gray and data in those cells are not included in the Stats rows for Count, Avg, SD, Min and Max (rows 12 to 16). Notice the filter applies to all tags because Exclude Rows is true.
