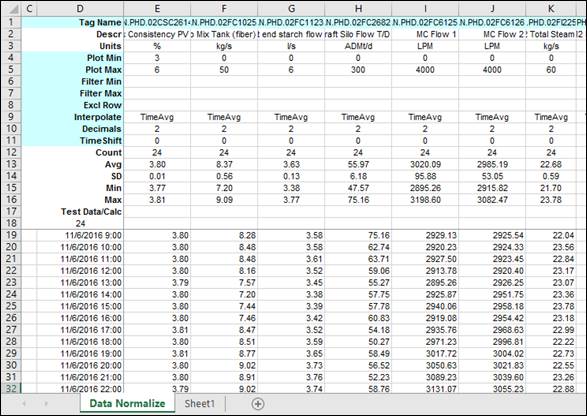
Purpose: Create a normalized data sheet and get data for some tags.
Task: Open Excel and add a Data Normalized sheet to the workbook. Launch the Tag Browser from Excel and select multiple tags. Drag them all into the normalized sheet. Get hourly time-weighted averages for the last 24 hours.
Steps:
Open a new Excel workbook.
Select the dataPARC tab of the ribbon bar.

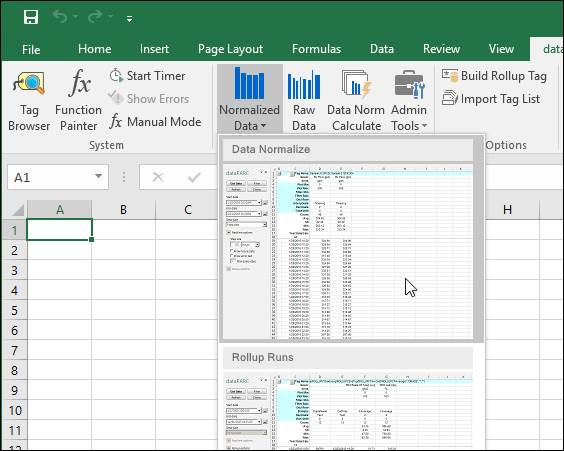
Open the Normalized Data drop-down menu and select the Data Normalize sheet.
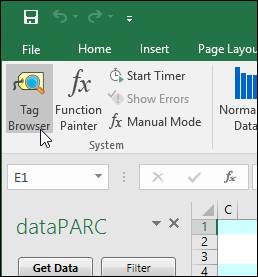
Next, launch the Tag Browser from the ribbon.
Search for tags. Select a range of tags (hold shift or control). Click on any tag in the list, hold down the left mouse button, drag all of the tags onto the sheet and drop them onto cell E1.
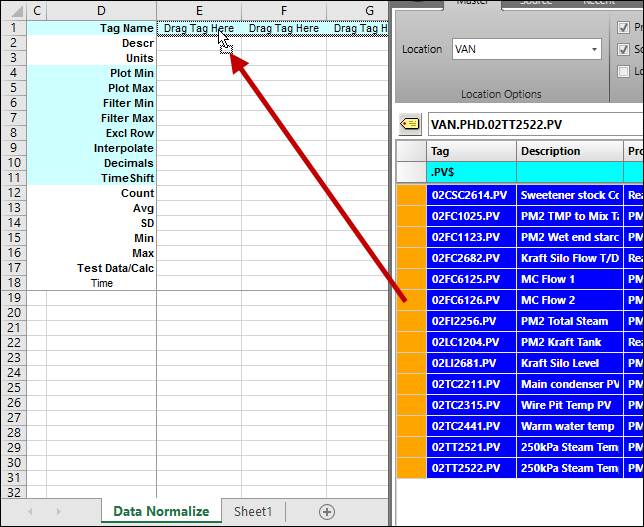 .
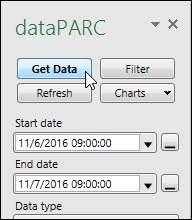
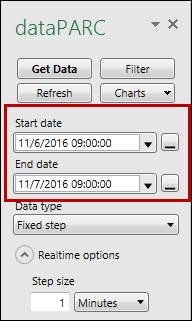
.In the dataPARC panel on the left, set the Start date and End date to be the last 24 hours, rounded down to the nearest hour.
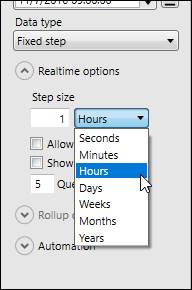
Change the Step Size to 1H.
Click the Get Data button. TimeAverage will automatically be selected as the Interpolation type.
