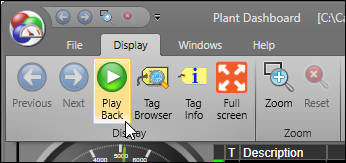
PARCgraphics typically only show the most current values for tags. To view historical tag data, use the play back feature.
Review past data at given intervals. Embedded trends and aggregated values will also update during play back.
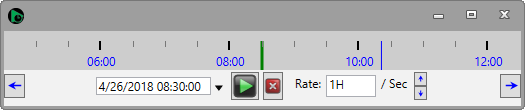
Time Axis: The green marker on the time axis indicates the time of the playback. A thinner blue marker indicates the current time. Click and drag the time axis to pan through time.
Left Arrow: Step back one interval.
Date: Select a specific playback start time. The position of the green marker will update when this date is changed, and vice versa.
Play: Begin playback. Click again to pause playback.
Cancel: End playback and reset the playback time to the current time.
Rate: The interval that the playback will step forward each second. Specify a number followed by a time key letter: S for seconds, M for minutes, H for hours, and D for days.
Up/Down Arrows: Double or halve the rate.
Right Arrow: Step forward one interval.