Range
- 01 Feb 2024
- Print
- PDF
Range
- Updated on 01 Feb 2024
- Print
- PDF
Article summary
Did you find this summary helpful?
Thank you for your feedback
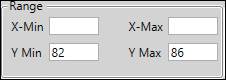
Filters: Filter out values of the X- or Y-tag using the X-Min, X-Max, Y-Min, and Y-Max fields. Enter the minimum or maximum values to include in the chart.
Was this article helpful?