Select the X and Y Tags for the chart.
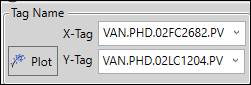
Selecting X and Y Tags: To add tags to an X/Y chart, drag them from the Tag Browser or other displays into the X- and Y-Tag fields (they can also be dragged directly onto the chart area).
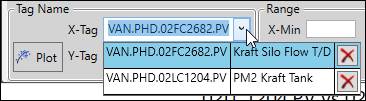
To switch the currently selected X- or Y-tag, open the drop-down menu and select a different tag. All of the tags added to the X/Y chart are available in both menus. Click the red “X” to remove a tag.
Plotting Data: Click the Plot button to retrieve tag data based on the X/Y chart’s current settings. If changes to the settings require the data to be re-plotted, the button will glow green.