Purpose: View Tag Limits in a Histogram chart and observe C pk calculations.
Task: Create a Histogram chart of a tag that has non-grade-based Control-type limits configured. Once open, enable the Not Grade Based limits and notice the C pk calculations in the legend.
Steps:
Create a Histogram chart of a tag that has non-grade-based Control-type limits configured.
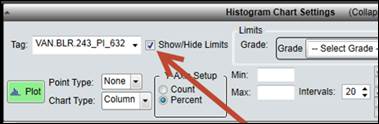
Check Show/Hide Limits.
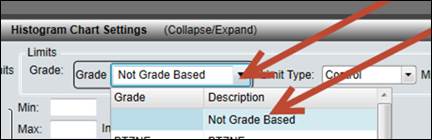
In the Grade selector, choose Not Grade Based and leave the Limit Type as Control.
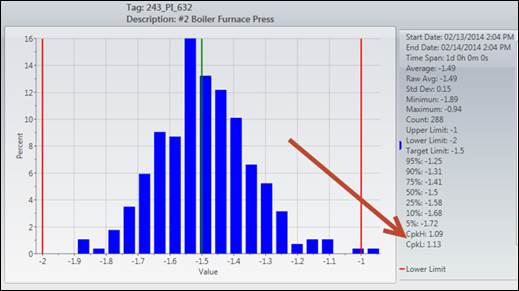
Click the Plot button and the tag’s limits will show on the Histogram as vertical lines. The green line is the target and the red lines are the upper and lower limits. Notice at the bottom of the legend C pkH and C pkL are calculated.