Filter Histogram Data
- 06 Feb 2024
- 印刷する
- PDF
Filter Histogram Data
- 更新日 06 Feb 2024
- 印刷する
- PDF
The content is currently unavailable in Ja - 日本語. You are viewing the default English version.
記事の要約
この要約は役に立ちましたか?
ご意見ありがとうございます
Purpose: Learn to filter data in a Histogram and change the number of intervals (columns).
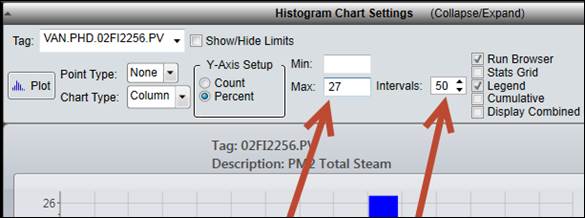
Task: Open or create a Histogram chart and filter out all data greater than a specified value. Increase the number of intervals.
Steps:
Open or create a Histogram chart.
Enter a filter value in the Max field. Click Plot to filter the data.
Increase the number in the Intervals field. Click Plot.

この記事は役に立ちましたか?

