Purpose: Practice building a Pareto chart with weekly runs.
Task: Open or create a new Pareto chart. Change the Period Type to Week (Monday), increase the run count to 5, and change the grouping style to By Reason.
Steps:
Open or create a new Pareto chart.
Expand the Run Browser panel if it is not visible.
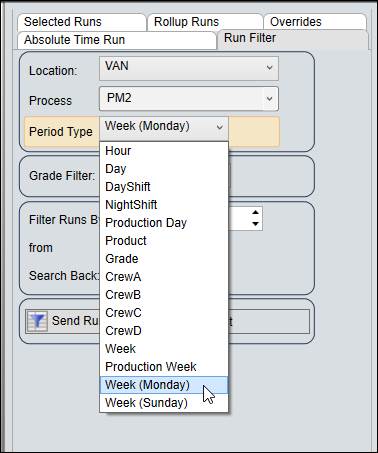
On the Run Filter tab, change the Period Type to “Week (Monday)”.
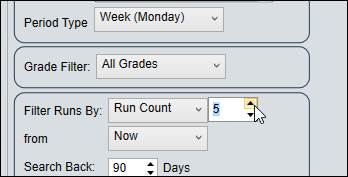
Increase the Run Count to “5”.
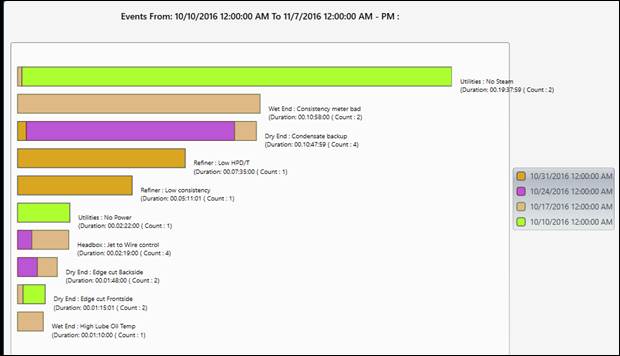
Click Plot.
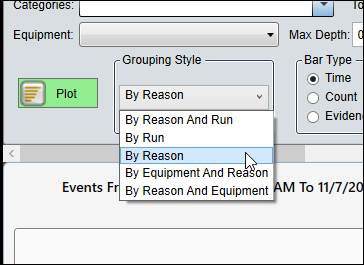
Change the Grouping Style to By Reason and click Plot again.