The Run Browser drives the Tabular Chart.
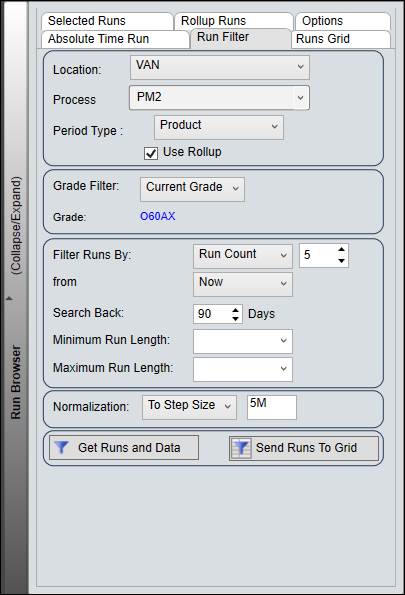
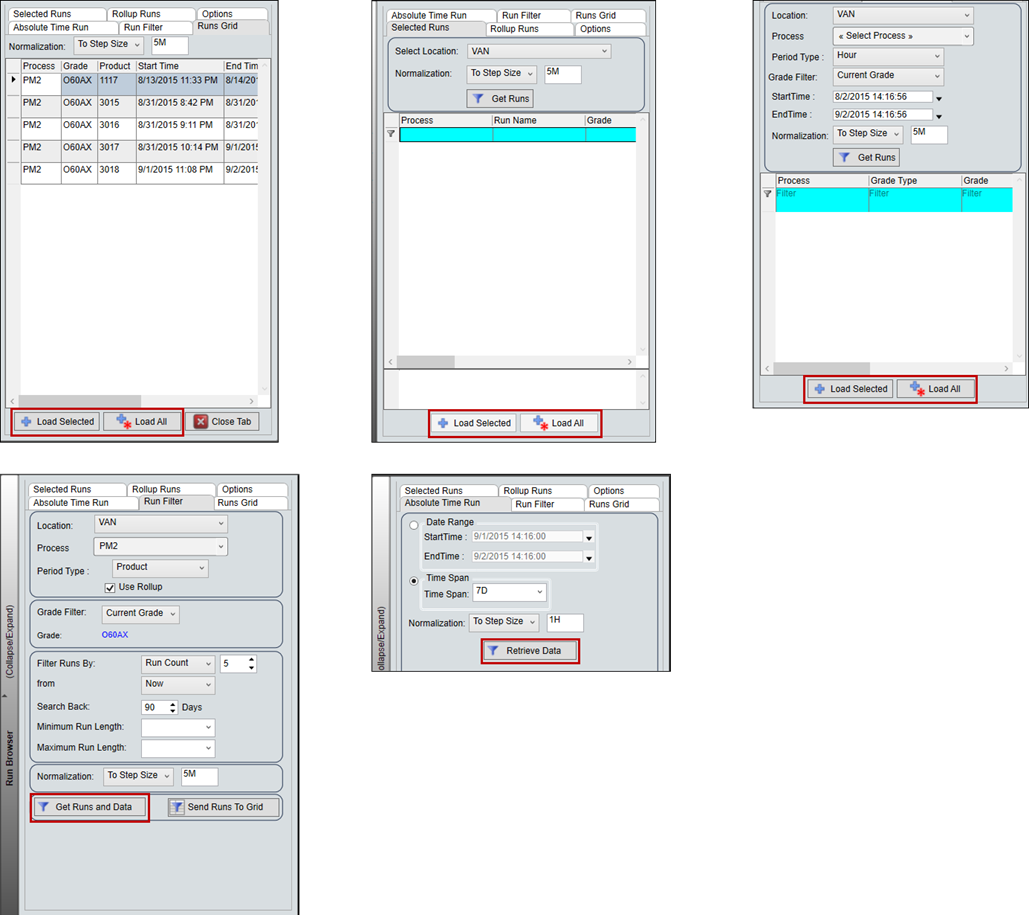
Entry Interval: The interval of time between each entry on the chart is configured by the Normalization settings in the Run Browser.
Load Runs: To load runs on the Tabular Chart, click the Get Runs and Data button, Retrieve Data button, or Load All button in the Run Browser.