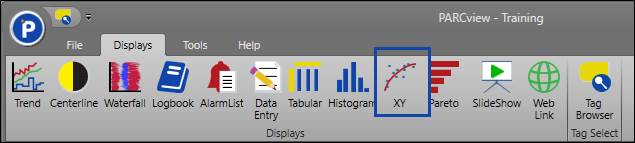
To create new X/Y, click the XY button on the PARCview Explorer’s Displays tab, or right-click in the file area of PARCview, hover over Add Display, and then select XY.
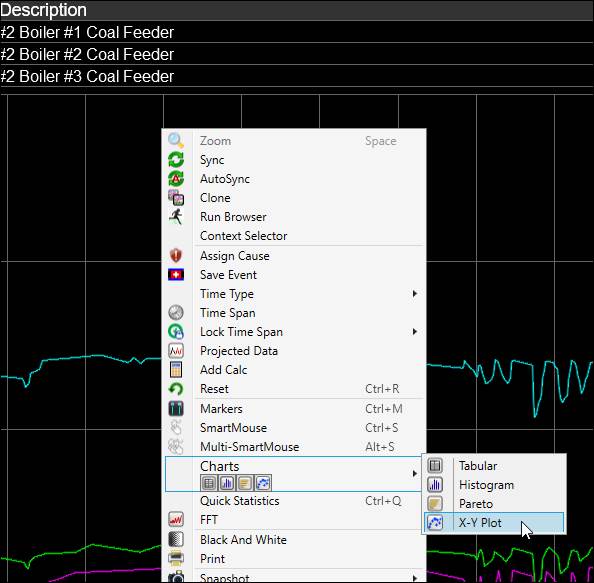
To create an X/Y from a trend, right-click the plot area, hover over Charts, and then select X-Y Plot. The chart that is created will use the source Trend’s tags and time span, and it will automatically load data. The tags used to create the X/Y are the first two in the grid, but the trend’s other tags are available in the tag selector.