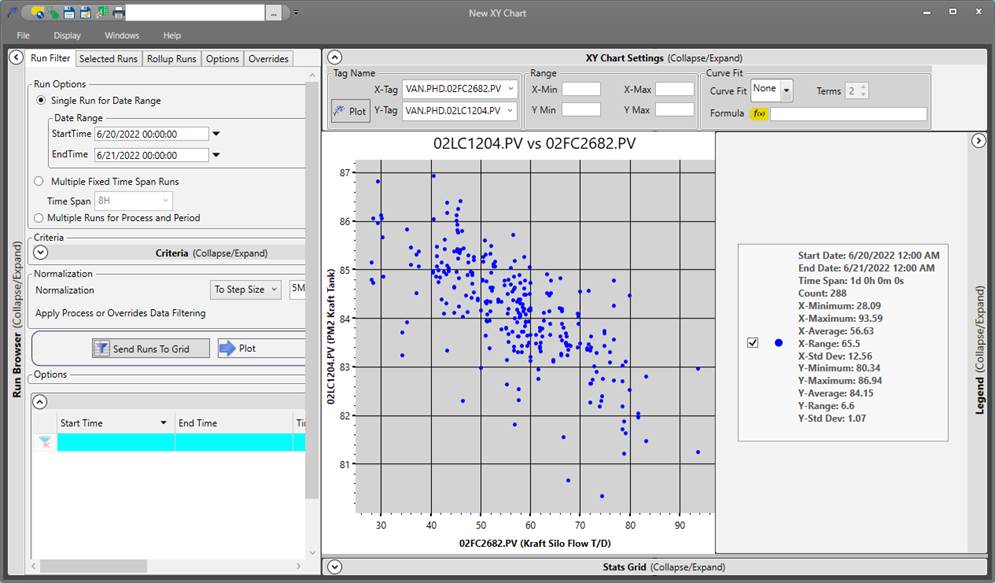
The X/Y chart shows the relationship between two tags as a scatter plot. The title at the top of the chart shows the Y-axis tag ID versus the X-axis tag ID. The X- and Y-axis will show the tag name / display ID as the axis title. The value range on each axis will be the smallest range while still showing all of the data points in the chart.