Purpose: Launch an X/Y chart from a Trend and save it as its own display.
Task: Open a Trend with two tags, launch an X/Y chart from the Trend plot area’s right-click menu, save the X/Y chart as its own display, and then close and reopen the X/Y chart.
Steps:
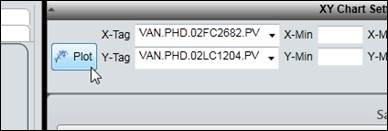
Create a new Trend and add two tags to the trend. These will be the tags in the X/Y chart.
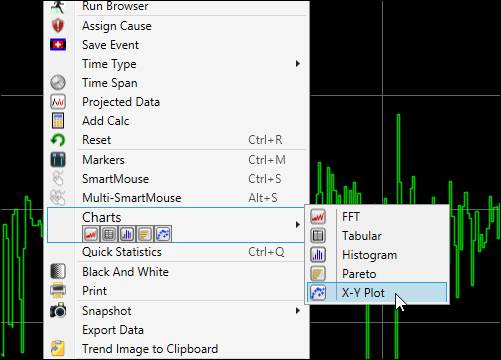
Right-click the plot area of the Trend, hover over Charts, and then select X-Y Plot.
On the File tab of the XY chart, click Save.
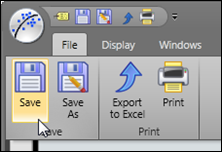
Save the file to your user folder.
Close the X/Y chart, then browse to your user folder and open your saved X/Y chart. Click Plot to retrieve data. Notice that the X/Y chart’s timespan defaulted to the past 24 hours instead of the source Trend’s default timespan.