Purpose: Learn to change the timespan of an X/Y Chart and do a linear fit to the data.
Task: Open the X/Y chart created in the previous tutorial or create a new display. Change its timespan to the previous 3 days and toggle on Linear Curve fit. Note the line’s formula and the calculated R-Squared value.
Steps:
Open or create an X/Y chart.
On the left side, in the Run Browser area, make sure Absolute Time Run tab is selected.
Next to “Time Span” click on the radio button to select it and choose 3D in the list
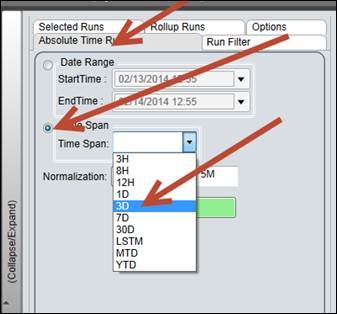
Click the Plot button.
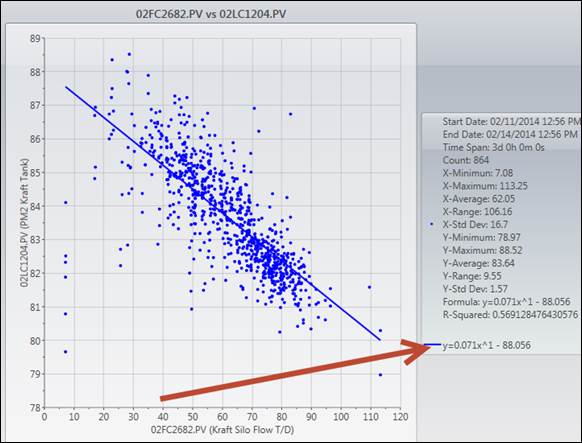
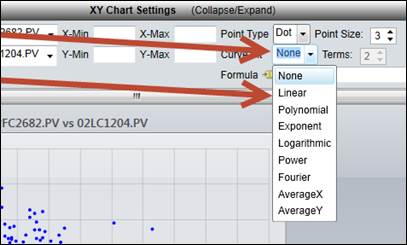
Above the X/Y plot area, open the Curve Fit menu and choose Linear.
Note the Formula and R-Squared value on the right side of the X/Y chart at the bottom of the legend.