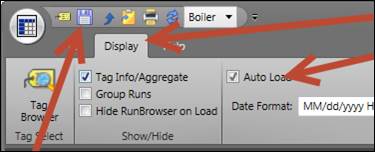
Purpose: Learn to make a standalone Tabular chart for a fixed timespan that autoloads daily averages.
Task: Browse to your user folder in PARCview Explorer and then create a new Tabular display. Open it and add tags from the Tag Browser. Set the Step Size to 1D, set the Time Span to 7D, and make each column a Time Average aggregate. Finally, set the Tabular chart to autoload data when opened.
Steps:
Go to your specific user folder.
Right-click and add a Tabular display and then name it. Open the Tabular chart.
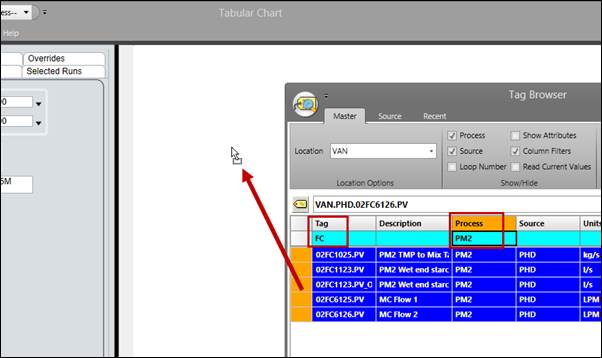
Open the Tag Browser.
Use the SHIFT key to multi-select tags (click on first tag in list, hold down the SHIFT key and click on the last tag in the list, then let go of the SHIFT key). Drag the tags onto the body of the Tabular chart.
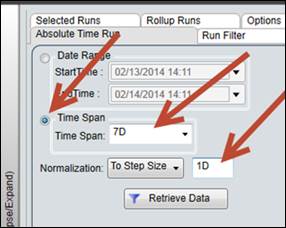
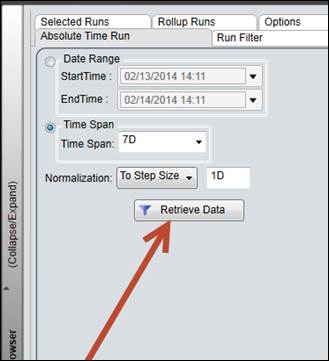
Set the Time Span to 7D and the Normalization to a Step Size of 1D.
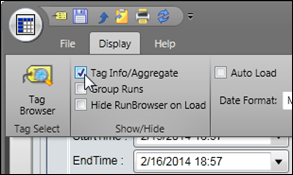
On the Display tab check Tag Info/Aggregate. This shows the tag information and aggregate section.
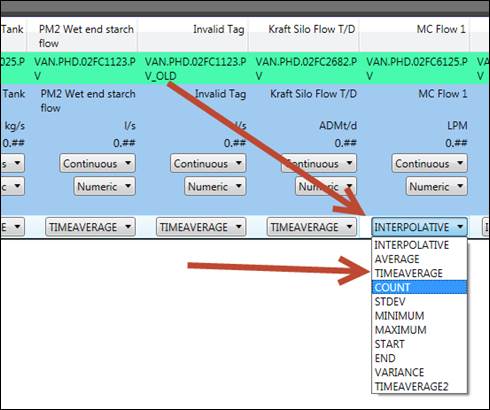
In the Aggregate menu, change INTERPOLATIVE to TIMEAVERAGE.
Click the Retrieve Data button.
On the Display Tab, check Auto Load.
Save the display.
