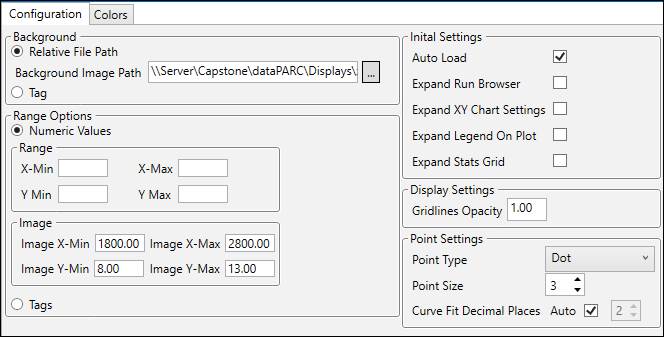
Background
Relative File Path: Select an image file to use as the background image.
Tag: Use a tag to set the background image. Likely an asset tag with the link datatype.
Range Options
Numeric Values: Manually enter values for the plot and image ranges.
Range: Enter values for the X and Y tag value range filters. Use any combination.
Image: Enter value ranges over which to overlay the background image. This is based on the value ranges of the X and Y Tags. If using the image range option, all four values must be entered.
Tags: Use tag values to set the plot and image ranges.
Initial Settings
Auto Load: Automatically load data based on Run Browser settings when the display is opened.
Expand Run Browser: Expand Run Browser panel when the display is opened.
Expand XY Chart Settings: Expand XY Chart Settings panel when the display is opened.
Expand Legend on Plot: Expand Legend panel when the display is opened.
Expand Stats Grid: Expand Stats Grid panel when the display is opened.
Display Settings
Gridlines Opacity: Opacity of gridlines on the plot area. Range of values is 0 to 1.
Point Settings
Point Type: Shape of points on the chart.
Point Size: Point size on the chart.
Curve Fit Decimal Places: Uncheck Auto to force the curve fit to show the set number of decimal places.