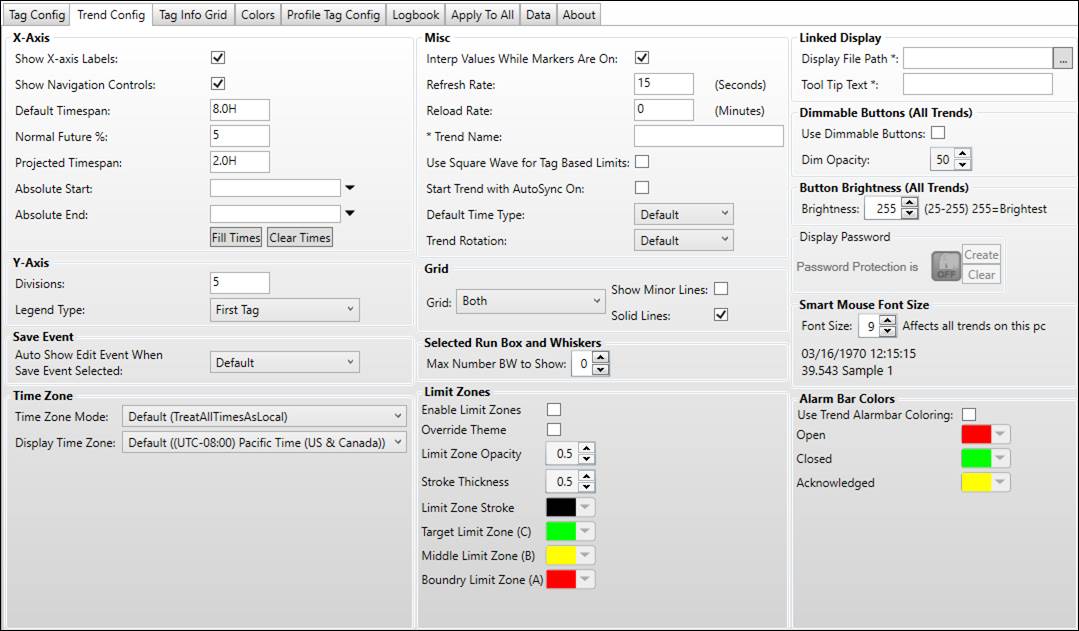
The Trend Config tab of Trend Properties contains options for configuring how the Trend will display tag data.
X-Axis
The X-axis section controls how the time axis appears and how the timespan behaves.
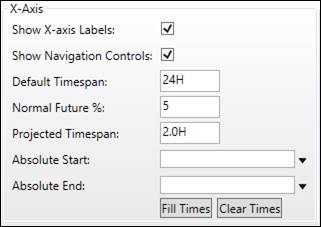
Show X-Axis Labels: Show or hide incremental time labels on X-axis.
Enabled:
Disabled:
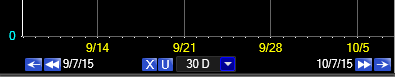
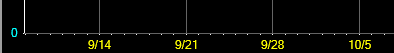
Show Navigation Controls: Show or hide X-axis buttons.
Enabled:
Disabled:
Default Timespan: Default timespan of the trend in hours (H), days (D), minutes (M) or seconds (S). Applies upon load or resetting timespan to default. There is a site-wide setting for the initial Default Timespan for new trend in System Configuration under System Defaults.
Normal Future %: Percentage of the plot area on the right reserved for future time. New data fills this space and when the trend line reaches the end of the trend, the X-axis shifts back, leaving this percentage of the screen available for new data. For example, with a value of 50, trend lines would build from the middle to the edge, then reset and build from the middle again.
Projected Timespan: The amount of time to show after the current time when Projected Data is enabled.
Absolute Start: Always loads the Trend with a fixed start date. This feature is useful for investigating a specific event in the past.
Absolute End: Always loads the Trend with a fixed end date.
Fill Times: Fill Absolute Start and Absolute End fields with current start and end time of trend.
Clear Times: Clear Absolute Start and Absolute End fields.
Y-Axis
Options for controlling the appearance of the Y-axis.
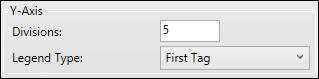
Divisions: Number of Y-axis tick marks and horizontal grid lines
Legend Type: Y-axis label options.
No Legend: Hide Y-axis
First Tag: The last selected tag’s color and plot min and max are displayed as the range for the plot. On opening the trend, the first tag’s range is used.
All Tags: Shows labels on the Y-axis for all tags. Each tag’s axis labels will match the color of its trend line.
Common Axis: Force all tags to use the same value range while still fitting all values within the plot area.
Save Event
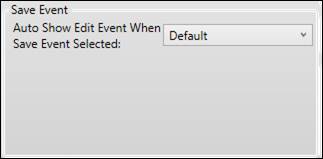
Auto Show Edit Event When Save Event Selected: This property controls whether or not to immediately launch the Edit Alarm window after using the Save Event command from the plot area’s right-click menu.
Default: Use System Default value.
Yes: Launch edit alarm window.
No: Do not launch edit alarm window.
Time Zone
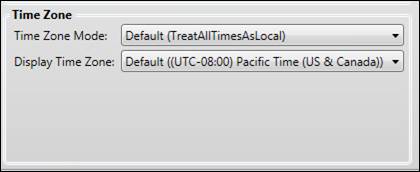
Time Zone Mode:
Default: Use default setting. The resolved default is shown in parentheses.
Treat All Times As Local: Treat all times as if they occurred in local time zone. This is pre-7.0 behavior.
Align to UTC: Align times to when they occurred in source time zone. For example, events that occurred simultaneously in different time zones will be trended as if they happened at the same time.
Display Time Zone:
Default: Use client PC’s time zone.
Time Zone: Select the time zone to use for displays opened on this client.
Misc.
These options control various Trend behaviors.
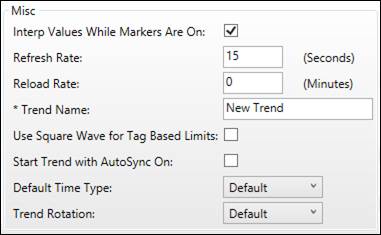
Interp Values While Markers Are On: When calculating the M1, M2, Delta values, this option determines whether to interpolate values to the timestamp of the marker or to use the point before the marker.
Refresh Rate: How often the trend retrieves current data, in seconds.
Reload Rate: How often the trend reloads all data, in minutes. If left blank, trend will not reload historical data automatically. This is useful for trending lab data they may be entered minutes or hours after its actual timestamp, but note that this setting may also impact performance if the trend has tags with dense data.
Trend Name: A Custom name for the Trend. Replace “Description” Header with Trend Name must be enabled to see the Trend Name on the display.
Use Square Wave for Tag Based Limits: For tag based limits, the Trend draws a vertical line to the new limit when it changes.
Start Trend with AutoSync On: Enables AutoSync when Trend loads.
Default Time Type: Time Type of data when Trend loads.
Default: The default setting for the tag or currently applied tag switch.
Plot: Forces all tags to use plot reduction logic for retrieving and displaying data.
Raw: Forces all tags to get every data point for the Trend.
Second: Forces all tags to retrieve and plot second data if it is available in the source.
Minute: Forces all tags to retrieve and plot minute data if it is available in the source.
Hour: Forces all tags to retrieve and plot hourly data if it is available in the source.
Day: Forces all tags to retrieve and plot daily data if it is available in the source.
Trend Rotation: Rotates the trend 90 degrees or not at all.
Grid
These options control how grid lines on the trend’s plot area are drawn.
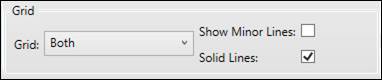
Grid: Changes which grid lines are displayed.
No Grid: No grid lines.
Horizontal: Only horizontal grid lines.
Vertical: Only vertical grid lines.
Both: Both horizontal and vertical grid lines.
Show Minor Lines: Whether to draw thin vertical lines between major grid lines at the tick marks.
Solid Lines: Whether lines are solid or dashed.
Selected Run Box and Whiskers
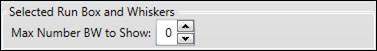
When trending selected runs, the maximum number of Box and Whisker plots to display.
Limit Zones
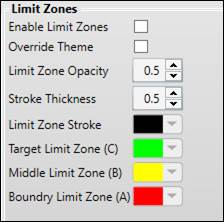
Enable Limit Zones: Show limit zone coloring on Trend plot area.
Override Theme: Override limit zone settings coming from color theme.
Limit Zone Opacity: Opacity of limit zone coloring.
Stroke Thickness: Thickness of line between limit boundaries.
Limit Zone Stroke: Color of line between limit boundaries.
Target Limit Zone (C): Use color picker to set color of zone C.
Middle Limit Zone (B): Use color picker to set color of zone B.
Boundary Limit Zone (A): Use color picker to set color of zone A.
Linked Display
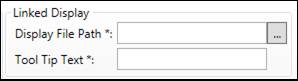
Using the Linked Display properties configures a hyperlink to another file. Clicking the ellipsis button launches the open file dialog, or an absolute or relative file path can be manually entered. Tooltip text can be added if desired.
Clicking the green arrow icon launches the link.
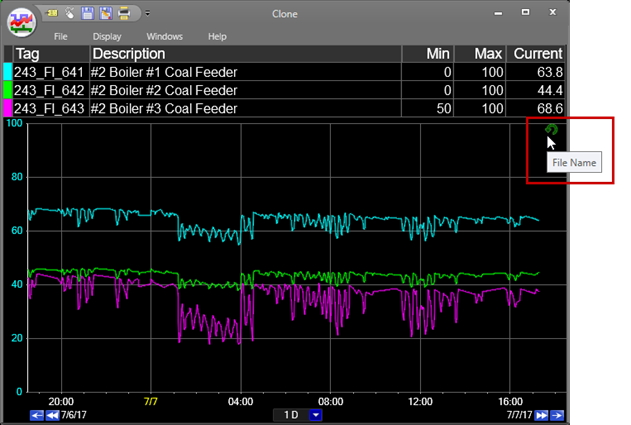
Display File Path: The file path to a linked display can be typed into this location or by opening the file browser using the button to the right of the field. A symbol to open the hyperlink will be added to the trend’s plot area.
Tool Tip Text: Toggles Tool Tip Text when the cursor hovers over the Link button (“File Name” in the screenshot above).
Dimmable Buttons
The dimmable buttons settings apply to all Trends opened on the client, and their effects are seen when either a MultiTrend or multiple Trend displays are opened.
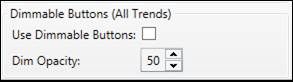
Use Dimmable Buttons: When enabled, only the buttons on the Trend currently underneath the mouse are at full brightness.
Dim Opacity: The buttons on other Trends are dimmed to the value of the Dim Opacity setting.
Button Brightness
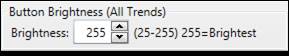
Brightness: Button brightness applies to all Trends opened on the client. This property controls the standard brightness of Trend buttons.
Display Password
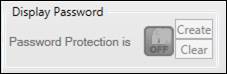
If enabled in system defaults, create or clear a display password to restrict users from modifying the trend.
If no password has been set, click Create and then enter and confirm the password. Passwords must be at least four characters long.
SmartMouse Font Size
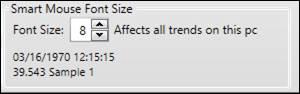
Font Size: Font size of smart mouse text. Applies to all Trends opened on the client.
Alarm Bar Colors
The alarm bar colors indicate if alarm events have been acknowledged. Leaving a comment or assigning a reason changes an unacknowledged alarm to acknowledged.
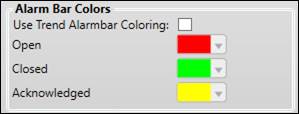
Use Trend Alarm Bar Coloring: When checked, use the specified colors for events in the alarm bar.
Open: The color of open alarm events.
Closed: The color of cleared alarm events.
Acknowledged: The color of acknowledged alarm events.