The Tag Info Grid lists the tags contained in the Trend.

Column Descriptions
The columns shown in the tag info grid can be changed through the header right-click menu or Trend Properties.
Trend Line Colors: The colored box is the color that the trend line appears in the plot. Right-clicking on the colored box change opens a color picker to change the color. Clicking on the colored box hides the tag. Hold Ctrl and click the color box to hide all Trend Lines other than the one selected. A black “X” appears when a trend line is hidden.
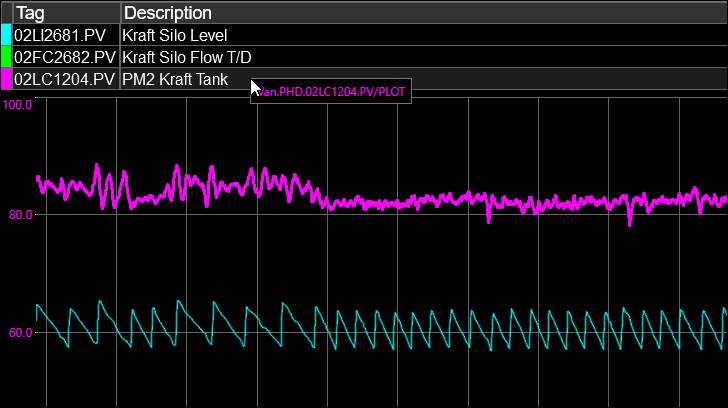
Tag Name: The name of the tag being plotted by the Trend. Clicking on the Tag Name allows the user to change which tag is displayed by typing in a Tag Name. A modifier, such as a filter or formula can be added to the end of a Tag name to change how the information is displayed on the trend.
Description: The description of the tag. Double-clicking on the Description opens a popup trend for the tag.
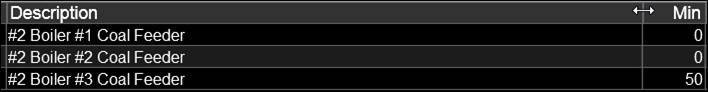
Plot Min and Max: The minimum and maximum values of the Y-axis. Changing these values changes the range of the Y-Axis. This only affects this trend and does not affect the tag’s native properties.
Current Value: The current value of the tag.
Units: A Units column can be enabled in the Tag Info Grid tab of the properties menu which displayed the units for the tag.
Marker Columns
When Markers are enabled up to 6 more columns can appear depending on the Tag Info Grid Properties.
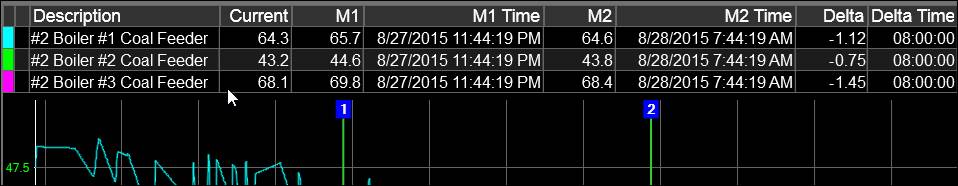
M1: The value of each tag at the first marker.
M1 Time: The timestamp of the first marker.
M2: The value of each tag at the second marker.
M2 Time: The timespan of the second marker.
Delta: The difference between the values of the tag at the two markers.
Delta Time: The difference between the timestamps of the two markers. If the difference is greater than 24 hours, no time is displayed. Double-clicking opens a standalone clone for the tag.
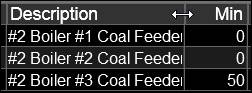
Resize Columns
The columns of the Tag Info grid can be resized by clicking between the columns when the double-headed arrow appears and dragging the column left or right. Double-clicking when the double-headed arrow appears automatically resizes the column.
Default column widths for new trends can be set in System Defaults.
Drag and Drop
Drag and drop tags directly from the tag info grid on to other trends or PARCview displays (note: click and drag from the Description field; clicking the Name field allows editing of the tag name). Holding CTRL while dragging and dropping onto another trend copies the tag and all its properties, instead of using the default. Holding ALT while dragging and dropping onto another trend moves the tag (deletes from the original and adds to the new).
Z-Order
The order of the tags in the tag info grid affects the draw order (z-order) of the trend lines in the plot area, with tags higher in the list being drawn on top of those lower in the list. Place “noisy” tags lower in the list so that they do not overwrite other tags.
Tag Highlight
Select a tag in the tag info grid to highlight its trend line on the plot area. If limits are enabled, the limit lines will also be highlighted. The highlight line thickness is a multiple of the tag's default line width set in Trend Properties.
Tag Info Grid Right-Click Menu
Right-click a tag’s row in the tag info grid to open the context menu. Note that any tag-specific options will apply to the tag whose row was right-clicked.
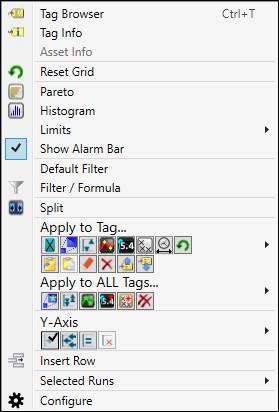
Tag Browser: Opens the Tag Browser.
Tag Info: Opens the Tag Info window.
Asset Info: Enables if an equipment instance is right-clicked. If the equipment is part of a control loop type, then the option to trend the full control loop will enable.
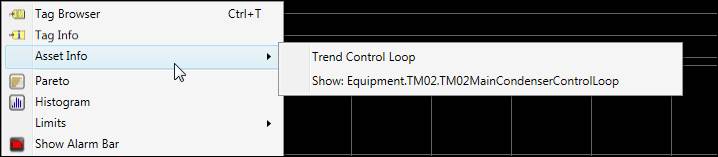
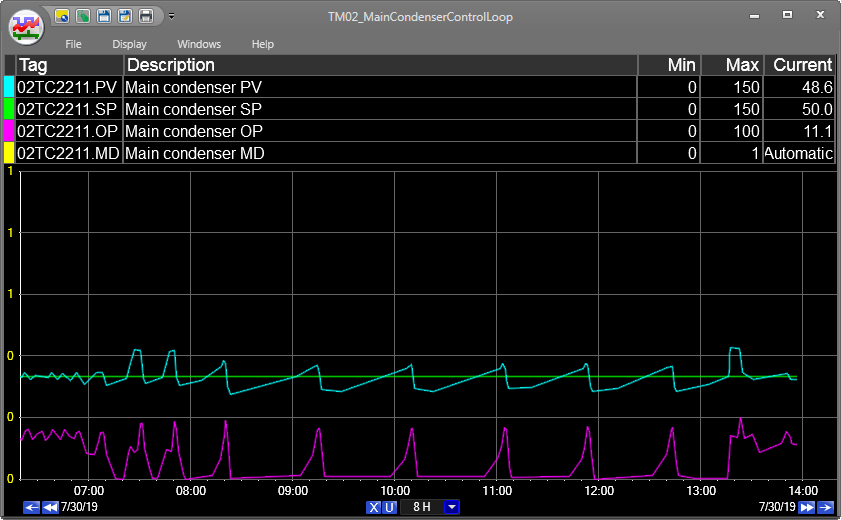
Trend Control Loop: Launch trend of PV, SP, OP, MD values in control loop type equipment instance.
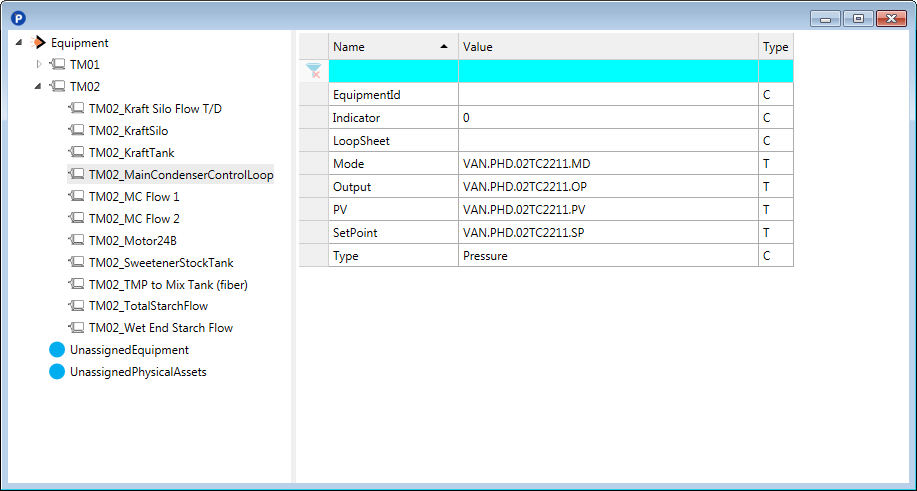
Show: Show equipment instance in equipment tree viewer.
Reset Grid: Reset grid to default layout.
Pareto: Opens a Pareto chart for all of the tags in the Tag Info Grid. The clicked-on tag will be the active tag in the chart. The Pareto chart uses the same timespan as the trend.
Histogram: Opens a Histogram Chart chart for all of the tags in the Tag Info Grid. The clicked-on tag will be the active tag in the chart. The Histogram chart uses the same timespan as the trend.
Limits: Toggles configured limits. Limits can be enabled for multiple tags at once. If a limit is grayed out, then the limit type has not been configured in PARCview. The configure menu allows the user to configure the limits for the tag. Clicking on a limit in the configure menu opens the Edit Tag Limit window and requires PARCsecurity permission.
Enable Limit Zones: Show limit zone coloring on the plot area. Configured on the Trend Config Tab.
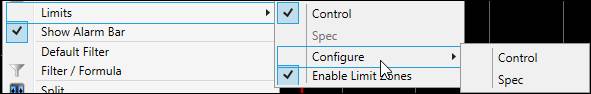
Show Alarm Bar: Toggles the Alarm Bar, which displays alarm events associated with a tag. Each trend tag can have its own alarm bar beneath the plot area. When limits are enabled for a tag, the alarm bar is also toggled on.
Default Filter: Applies the Default Filter for the selected tag. The filter can be configured in the Process tab or Process Tags tab of System Configuration.
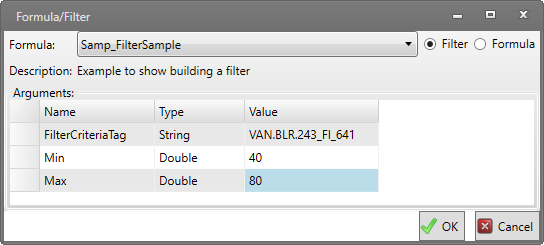
Filter/Formula: Opens the Filter Select window. A filter or formula can be selected to apply to the tag in order to filter out or modify values. Select a filter or formula and then enter any required arguments, if applicable. Filters and formulas can be created and modified in the Script Editor.
Split: Creates a two-trend clone of the existing trend. The top trend contains the selected tag and all tags above it and the bottom trend contains all other tags from the trend. If the first tag is selected no change occurs.
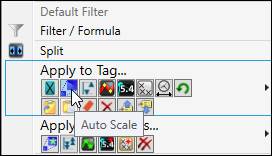
Apply to Tag: The apply to tag settings affect the tag whose row was right-clicked. Click an icon button, or open the popout menu and select an option. The icon buttons function like toggles: click once to enable, click again to disable.
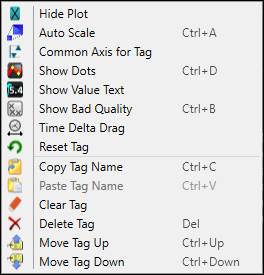
Hide Plot: Hides the trend plot in the plot.
Auto Scale: Changes Y-Axis scale of the selected tag based on minimum and maximum values of the selected tag in the trend so that all the data nicely fits in the window. Useful if values are outside of the tag’s typical range, or if values vary over a wide range over time.
Common Axis for Tag: Force all tags to use this tag’s plot min and max.
Show Dots: Shows a dot on the trend line at the timestamp of all real data points.
Show Value Text: Shows the value and timestamp for each data point in the trend. The value text only appears on the plot if there is enough space between points for the text to fit. For trends with many data points zooming may be required to see the value text.
Show Bad Quality: Adds a bad quality marker for each bad quality data point for the specified tag in the trend.
Time Delta Drag: Allows the x-axis to be shifted by dragging for the selected tag. Shifting the axis displays the tag using a different time frame than the other tags. This is useful for viewing correlations that are offset by a certain amount of time. The delta time shift is NOT reset when this setting is disabled.
Reset Tag: Resets the following tag properties to defaults: PlotMin, PlotMax, Description, Tag Name, Units, Interpolation, Data Type, Draw Mode, Tag Extension, Delta Time Expression
Clear Tag: Removes the tag, leaving a blank row.
Delete Row: Removes the tag and the row.
Move Tag Up: Moves the tag up one row in the tag info grid. The order of the tags in the tag grid affects the order in which trend lines are drawn (z-order), with tags lower on the list being drawn on top of those higher on the list.
Move Tag Down: Moves the tag down one row in the tag info grid. The order of the tags in the tag grid affects the order in which trend lines are drawn (z-order), with tags lower on the list being drawn on top of those higher on the list.
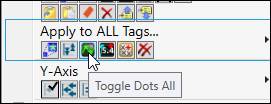
Apply to All Tags: The apply to all tags settings affect all tags in the trend. Click an icon button, or open the popout menu and select an option. The icon buttons function like toggles: click once to enable, click again to disable.
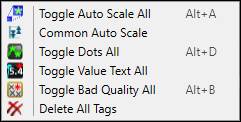
Toggle Auto Scale All: Auto-scales all tags.
Common Auto Scale: Force all tags to use the same value range while still fitting all values within the plot area. Same as the Common Axis property.
Toggle Dots All: Shows dots for every value in trend.
Toggle Value Text All: Shows value and timestamp for all data points for all tags.
Toggle Bad Quality All: Shows bad quality markers for all tags.
Delete All Tags: Deletes all tags and returns to the number of rows configured in the Tag Info Grid properties.
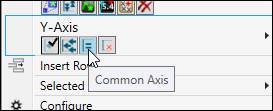
Y-Axis: The Y-Axis settings affect the value ranges (plot min and max) used by the trend. Click an icon button, or open the popout menu and select an option. The icon buttons function like toggles: click once to enable, click again to disable.
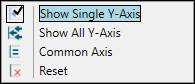
Show Single Y-Axis: Show the value range for one tag at a time. The range shown is for the tag selected in the Tag Info Grid.
Show All Y-Axis: Show values ranges for all tags. Though this takes up more screen real estate, it is more useful for printing and screen shots.
Common Axis: Force all tags to use the same value range while still fitting all values within the plot area.
Reset: Reset the Y-axis to its initial state.
Insert Row: Inserts a blank row at the clicked on position and move all tags beneath it down one row.
Selected Runs: Retrieves and plots saved runs as box and whisker plots. Saved runs are managed through Centerline and the Run Browser.
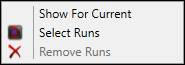
Show For Current: Displays Box and Whisker plots of selected grade runs for the current grade, based on the selected tag’s Process Area grade tag.
Select Runs: Opens the Manage Selected Runs form with the target tag preloaded. Box and Whisker plots of runs saved for the selected tag can be loaded in the Trend.
Remove Runs: Remove the currently plotted selected runs.
Configure: Opens the Trend Properties window on the Tag Config tab.
Tag Info Grid Header Right-Click Menu
Right-click the tag info grid header row to open the menu.
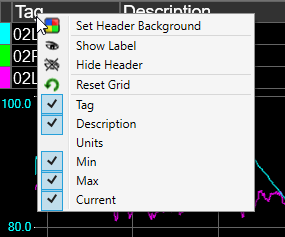
Set Header Background: Open color picker to set color of header row. Useful to differentiate trends in a multitrend.
Show Label: Show the Trend label row. When shown options in the right-click menu applicable to the label appear:
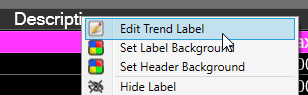
Edit Trend Label: Makes the label row editable. Enter text to change the label.
Set Label Background: Open color picker to set color of label row.
Hide Label: Hide label row.
Hide Header: Hides the header row. If the label is shown, the right-click menu can still be opened, and the Show Header option is available. Use Reset Grid from the Tag Info Grid right-click menu.
Reset Grid: Reset grid to default layout.
Columns: Checked columns are shown in the grid.