Configure the source of the profile data and how the values are plotted.
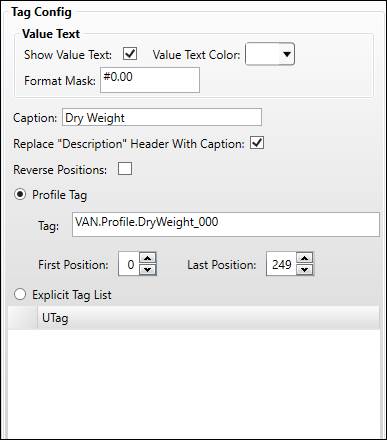
Show Value Text: Shows the value at each position in the Profile Trend. The value text only appears on the plot when zoomed in far enough.
Value Text Color: The color of the value text.
Format Mask: A mask for the Value Text. Format masks are primarily used to determine the number of significant figures displayed for a numeric value. The syntax is 0’s for forced digits and #’s for unforced digits.
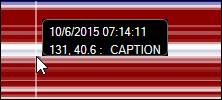
Caption: The caption can be displayed at the top of a waterfall, and is shown when SmartMouse is enabled for the Profile Trend.
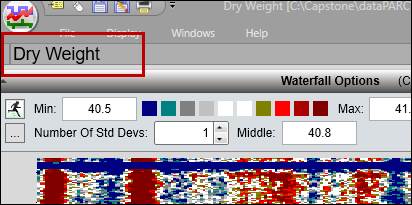
Replace “Description” Header with Caption: If checked, shows Caption text in place of the Description Header. Used to title Waterfalls, especially in MultiTrends.
Reverse Positions: If checked, the Waterfall will treat the first position as the last and vice versa.
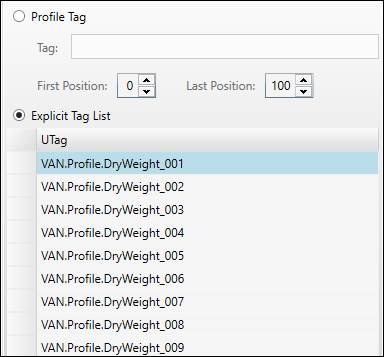
Profile Tag: Use an array-type tag as the source of profile data.
Tag: Specify the UTag the profile tag. Drag and drop from Tag Browser or manually enter the name.
First Position: The first position of the data to plot.
Last Position: The last position of the data to plot.
Explicit Tag List: Use a list of tags as the source of profile data instead of a single profile array tag. Drag and drop a set of tags from Tag Browser. The first tag in the list corresponds to the first position (position 0).