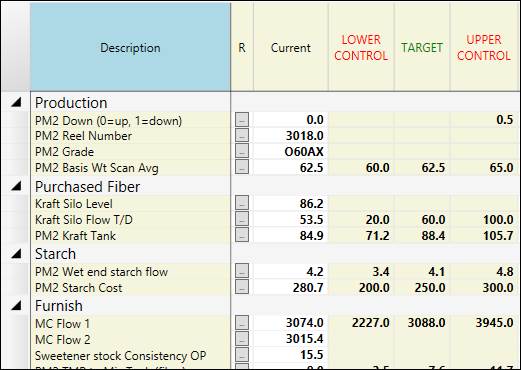
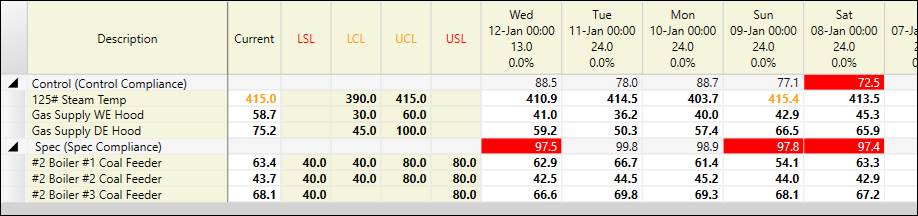
Centerline tags appear as rows in the report by default, though the report may be pivoted.
Hovering over a row displays the full UTag name.
Double-click a tag row to launch a “popup” trend of the tag. Note: this trend will have topmost enabled.
Column Descriptions
Description: This column shows the tag’s description (typically the tag’s default description, though this can be custom to the centerline).
R (Assign Cause): This will open the Assign Cause window to view and edit alarm events. If the button is red, there is an unacknowledged event in the last seven days. If the button is yellow, there is an ongoing event but it has been acknowledged. If the button is grey, there are no unacknowledged alarm events in the last seven days or all events have been responded to.
Current: The Current column shows the most recent value for the tag. When enabled in properties, if the value exceeds the tag’s limits it will change color. The colors are configurable under the Settings tab in the Properties menu. By default the centerline updates current values every 60 seconds; this can also be configured in the Settings tab.
Tag Limits: If using tag limits, the columns for the enabled limit types display the effective tag limits.
Temp Target: This column is for a temporary target value. By default, this option is already enabled. The option to hide or show this column is under the Settings tab in the Properties menu where it says “Hide Temp Target Column”. If checked the column will be hidden, and if unchecked the column will be visible. Any person can input a value into the column once it is visible and the value will remain in that column until it is manually cleared.
Collapse/Expand Sections
Tag rows may be grouped into labeled sections. Click the “-” and “+” buttons to collapse and expand the sections. Some sections may be collapsed when the centerline is opened, based on its configuration. Data is not retrieved for collapsed sections.
KPI Limit Compliance
Centerline groups can be configured to show the total percentage of time during a run when the tags in the group were within limits for a given limit type. The group header changes color when the percentage exceeds a configured threshold. See Centerline configuration for more.
Description Column Right-Click Menu
Right-click a tag row under the Description column to see the right-click menu options available.
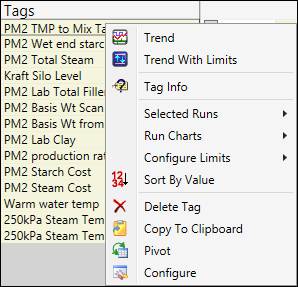
Trend: A Trend of the tag will open. Double-clicking the row will also launch the trend.
Trend with Limits: A trend of the tag will open with the limits enabled in the trend.
Tag Info: Displays the Tag Info window for that tag.
Selected Runs: Options for trending, managing, and saving selected runs, see below.
Run Charts: Create a histogram or run trend from the highlighted run column(s), see below.
Configure Limits: The list of limit types enabled in System Configuration will appear in this list. Selecting any of the limit types will open the Tag Limits where the limits of the selected tag can be viewed or modified.
Sort By Value: Sorts the data columns in order from the largest value to the smallest value based off of the value of the selected tag.
Delete Tag: This will remove the tag from the centerline.
Copy To Clipboard: Copies the Centerline data to the Clipboard, from where it can be pasted into applications like Microsoft Excel.
Pivot: Enable pivot mode.
Configure: Opens the Properties window.
Selected Runs Options
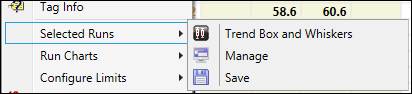
Trend Box Whiskers: Does not function in this version.
Manage: Opens Manage Selected Runs.
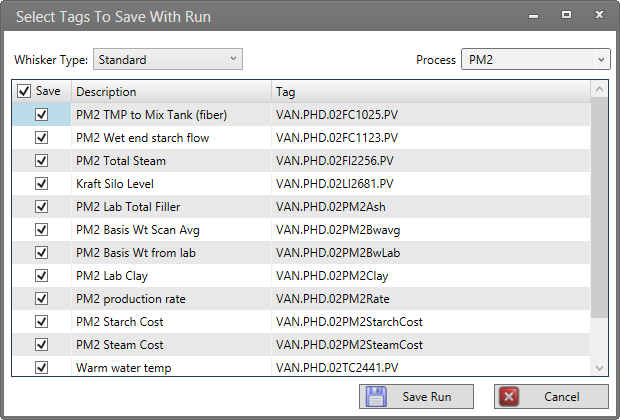
Save: Selecting this option will open a window that lists the tags in the centerline with a checkbox to select/unselect any of the tags. Tag rows will be highlighted in red if they cannot be saved (not assigned to a process area). There are two drop-down menus. The Whisker Type drop-down menu allows either the Standard or SQC type to be chosen. The Process drop-down menu allows any of the processes to be selected.
Manage Selected Runs
In order to enable this option, some runs must first be saved, either from previous centerlines or from the current centerline. To save a run, highlight the desired column or columns and click Save Runs. To highlight a column, right-click on the column header and select Highlight to highlight the column selected or Highlight All to highlight all of the columns of data. Select Manage Runs and the Manage Selected Runs window will open.
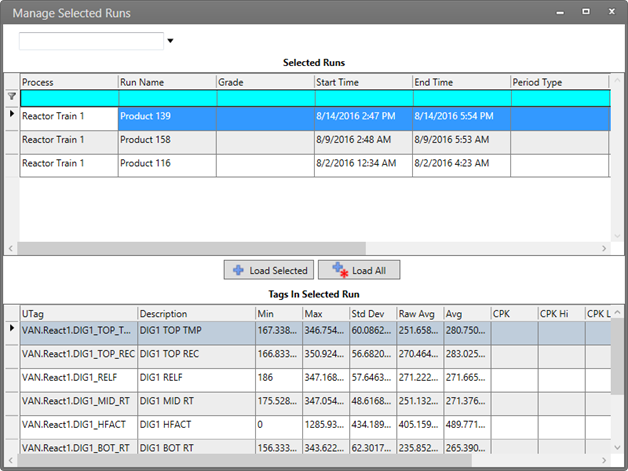
Selected Runs Section: In this part of the window, all of the runs that have been saved can be seen. The Priority field can be edited here. Selecting a run will update the Tags In Selected Run section.
Load Selected: This button allows a run selected from the Selected Runs section to be added to the centerline.
Load All: Load all selected runs from the grid in the centerline.
Tags In Selected Run Section: In this part of the window, all of the tags with the statistics associated with the run selected will be listed.
Run Charts Options
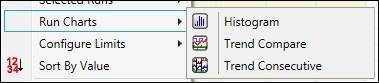
Run Charts: In order to open a chart with data in it, one or more of the run columns must first be highlighted. To highlight a column, right-click on the column header and select Highlight to highlight the column selected or Highlight All to highlight all of the columns of data. Clicking Histogram, Trend Compare or Trend Consecutive under Run Charts will open another window with whichever chart and columns were selected. Under the Chart Type tab in that window, it shows the three charts available. Selecting a different chart than the chart currently selected will switch the display to match the proper layout.
Current Column Right-Click Menu
Right-click a tag row under the Current column to see the right-click menu options available.
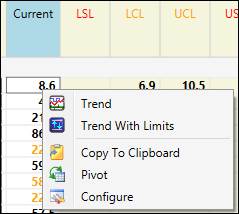
Trend: Clicking Trend will launch an 8 hour trend of the tag. Double-clicking the row will also launch that trend.
Trend With Limits: Launches an 8 hour trend of the tag with the limits from the centerline enabled in the trend. Only displayed when limits are enabled for a tag.
Copy To Clipboard: Copies the Centerline data to the Clipboard, from where it can be pasted into applications like Microsoft Excel.
Pivot: Enable pivot mode.
Configure: Opens the Properties window.
Limit Columns Right-Click Menu
Right-click a tag row under any of the limit columns to see the right-click menu options available.
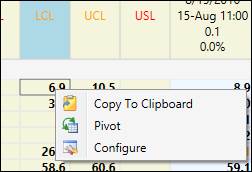
Copy To Clipboard: Copies the Centerline data to the Clipboard, from where it can be pasted into applications like Microsoft Excel.
Pivot: Enable pivot mode.
Configure: Opens the Properties window.
Group Header Right-Click Menu
Right-click a tag group header to open the context menu.
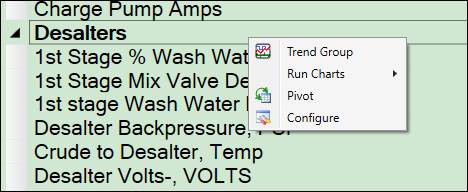
Trend Group: Launch a trend of all tags in the group.
Run Charts: See Run Charts.
Pivot: Enable pivot mode.
Configure: Opens Centerline Configuration.