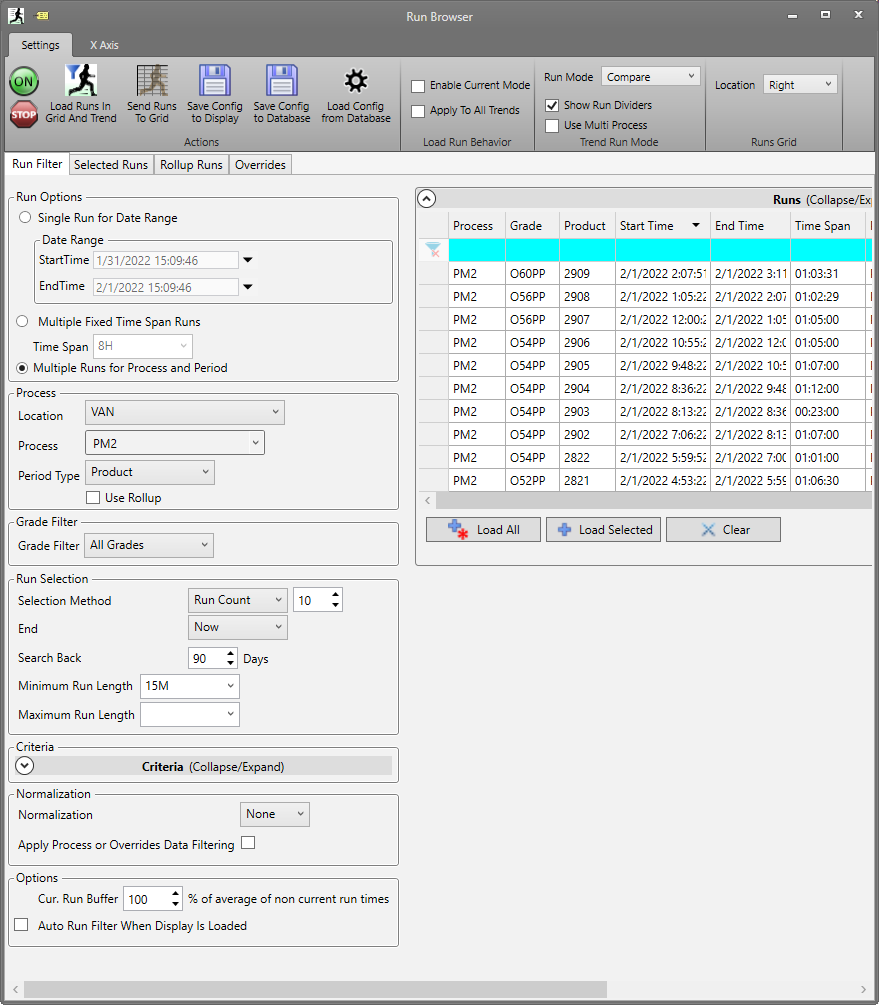
The Run Filter tab contains the primary features of the Run Browser. In general, the main purpose of the run filter is to allow users to view only the periods of time that are of interest. One way this is done is by dividing data by period type so that distinct periods of time that may not have occurred consecutively can be viewed simultaneously. For example, the last five runs of a specific product type, or “grade”, can be viewed as if they happened consecutively, even if there were grade runs of a different type or downtime in between. Runs can also be overlaid for comparison instead of viewed consecutively, but the concept of generating the runs remains the same. The ability for users to provide custom run criteria extends the functionality beyond pre-defined time periods.
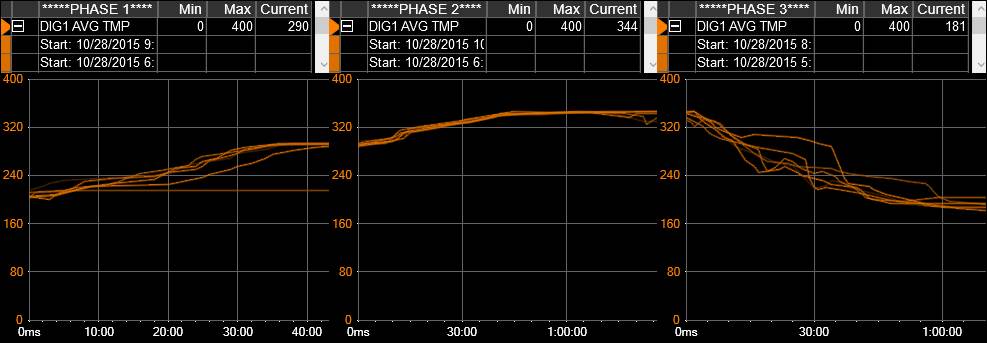
Based on selections made by the user, the interface of the Run Browser will change to show the relevant further choices. For example, when working with a grade-based process area the grade filter will appear when otherwise it would not show. In particular, when in Batch Run Mode the interface is optimized to view phase-based data in Trends.
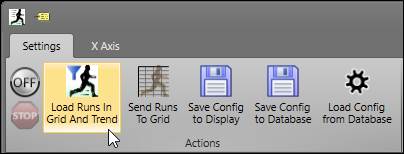
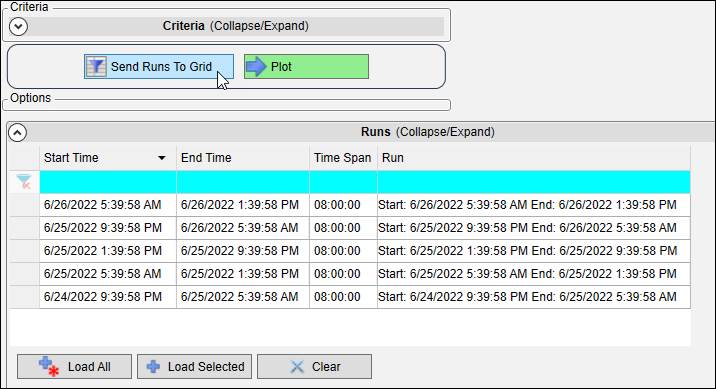
After filling out the run criteria, load runs from the Settings tab for the Trend Run Browser, or the Plot button for other displays.
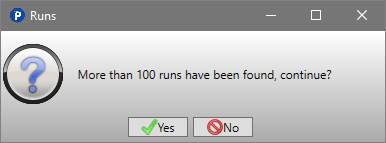
A warning appear if the number of runs generated exceeds 100.
Run Options
The Run Options determine how runs will be generated.
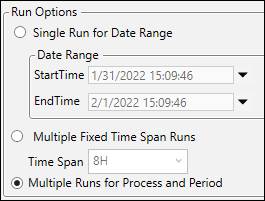
Single Run for Date Range
Use the calendar to set specific start and end times for the run.
StartTime: The start time of the run.
EndTime: The end time of the run.
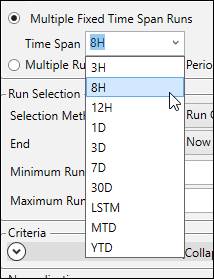
Multiple Fixed Time Span Runs
Set a fixed run duration, for example 12 hours or 3 days. The Run Selection section still applies when Time Span is selected. This allows users to find multiple instances of a custom time span.
Time Span: Choose from the list of time spans, or enter a custom timespan as a number followed by a time key letter: S for seconds, M for minutes, H for hours, and D for days.
Multiple Runs for Process and Period
Use a process area’s configuration to generate runs. When this option is selected, the Location / Process / Period Type options become available.
Process
The options in this section are driven by what has been configured in PARCview System Configuration.
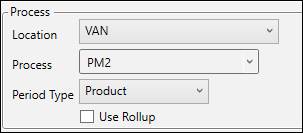
Location: Select the location. This determines which process tree is loaded.
Process: The selected process area determines which process-based period types are available. Process Areas can be configured to have tags for grade runs, product runs, and phases within product runs. The Process Area should generally match the tags in the display, otherwise the runs that will be generated might not represent actual operating conditions.
Period Type: The type of period used to partition the data. The options available are those selected in the Include in Run Browser column of the Time Groups tab in System Configuration.
Use Rollup: If run times are available from PARCrollup Server for the selected process and period type, use those runs instead of regenerating them. Depending on how the Rollup Server is configured, the rollup runs are likely not identical to the process area grade runs.
Grade Filter
Use the Grade Filter to only show data for times when selected grades were running. The grades must already be configured for the location and process area. Grades are configured in Grades.
Grade Filter: Choose the method for picking grades.
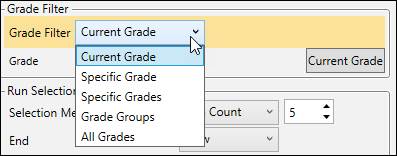
Current Grade: View data for current grade. When the grade changes, Run Browser will update to show data for that grade.
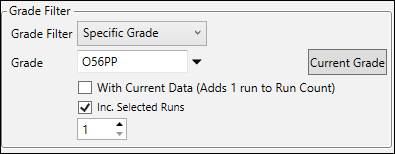
Specific Grade: Select from a list of configured grade names.
Specific Grades: Select one or more grades from the list.
Merge Consec. Grades: When Specific Grades is chosen, if two grade runs of different grades occur consecutively, merge them together.
Grade Groups: Select grades from pre-configured grade groups. Grade groups are configured in Grades.
All Grades: View data for all grades. Effectively like ignoring the grade filter.
Current Grade Button: Set specific grade to current grade.
With Current Data (Adds 1 run to Run Count): Show data for the current grade run in addition to the chosen runs.
Inc. Selected Runs: Whether to include any saved selected runs for the grade, and how many.
Hide Grades
The visibility of grades in Run Browser can be toggled using the Active field in the ctc_gradename table in the ctc_config SQL database. This only affects Run Browser as of 7.2.0.0.
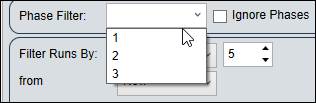
Phase Filter
The Phase filter is applicable when the selected process area has a phase tag set in Process.
Phase Filter: The Phase Filter allows for selecting only data from a certain phase. The phase must already be configured for the location and process area. Only a single phase may be displayed at a time.
If Ignore Phases is selected, Run Browser will not include phases in its search criteria.
Phases are configured in Phases.
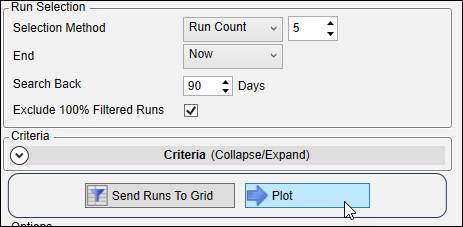
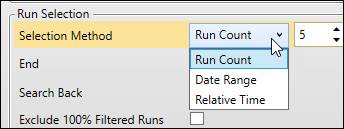
Run Selection
Select Method: Choose the run selection method.
Exclude 100% Filtered Runs: If the filter condition is true for the entire run, do not include it in the run set.
Minimum Run Length: Runs short than this are excluded. Enter a timespan.
Maximum Run Length: Runs longer than this are excluded. Enter a timespan.
Run Count
Generates up to as many runs as are entered in the corresponding entry box.
End: Set the end time of the search range.
Now: Searches for most recent runs starting from the current time.
Date Range: Search back from given date.
Relative Time: Search for runs over a relative time window, see Relative Time Syntax for more information.
Search Back: Set the start time of the search range as a number of days prior to the end time.
Date Range
Searches for all runs over a range of time for runs.
Start: The start time of the range.
End: The end time of the range.
Relative Time
Search for runs over a relative time window, see Relative Time Syntax for more information.
Start: An expression for the start of the time span.
End: An expression for the end of the time span.
Criteria
Use tag data to further divide and filter the run set. Click the Criteria section header to collapse and expand the section.
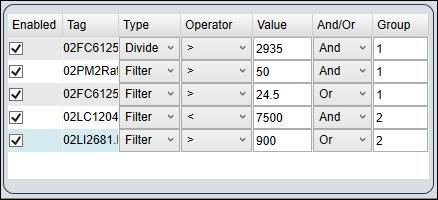
Drag and drop tags onto the grid to add rows. In general, the idea is to use a tag to divide the time period(s) into runs, for example when a given tag’s values are above a certain threshold, and then to use one or more tags to filter the data.
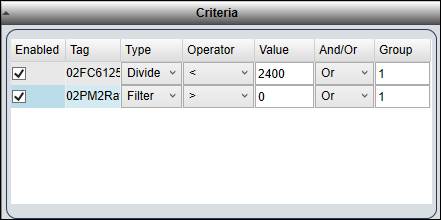
Enabled: Whether to apply the Divide/Filter criteria.
Tag: Short name of the tag’s values that will be used.
Type: Select Divide or Filter.
Divide: Use tag’s values to generate runs. Runs are generated for times when the divide criteria are true.
Filter: Use tag’s values to filter data. Data is shown for times when the filter criteria are true. In other words, data not meeting filter criteria are removed.
Operator: Select logical operator used to compare tag value to specified value. When Divide is selected, additional option Change is available. This creates a new run when the tag value changes, the same behavior used to create grade and product runs from grade and product tags.
Value: Value to compare to tag value. Not applicable when Change operator is selected.
And/Or: Applicable if using multiple filter criteria. Used to build the filter logic. See the right-click menu option to preview the full filter formula.
Group: Applicable if using multiple filter criteria. Used to group filters in the filter query. See the right-click menu option to preview the full filter formula.
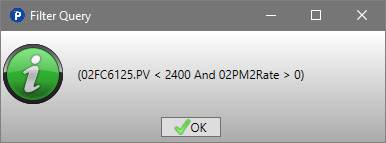
Right-Click Menu
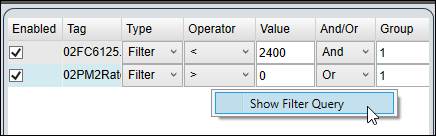
Show Filter Query: Opens window that shows the filter formula. Useful to preview the And/Or logic and grouping of multiple filters.
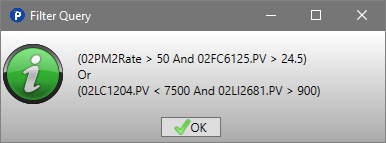
Grouping
Use grouping in combination with the And/Or column to build more precise filters. Use the Show Filter Query option to preview the results.
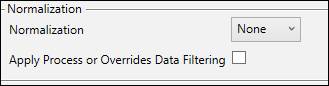
Normalization
Determine how timestamps and data are collected for the tags in the runs.
None: No normalization.
To Step Size: Will normalize to the step, with units, supplied in the box. Units are formatted as they are in trends: M for minutes, S for seconds, etc.
To Manual: Will normalize all tags to the first manual tag in the Trend. If no tags are set to manual interpolation, it will use the first tag in the Trend.
To All Times: Will normalize to all available timestamps of all tags except for manual tags. If the Interpolate Manual is checked, it will interpolate a data point at all available timestamps for all tags, including manual tags.
To Run: Calculates a single aggregated value for each run. Select the aggregate type from the drop-down menu.
Apply Process or Overrides Data Filtering: Remove data based on process or override filter criteria.
Options
Note: This section applies to Trend displays only.
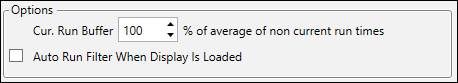
Cur. Run Buffer: When in Current Mode (see Settings), how much trend space to allocate to the current run as a percentage of the average length of the other runs in the set.
Auto Run Filter When Display Is Loaded: If checked, the last saved Run Browser configuration will be used to generate runs when the Trend is opened. Make sure to save.
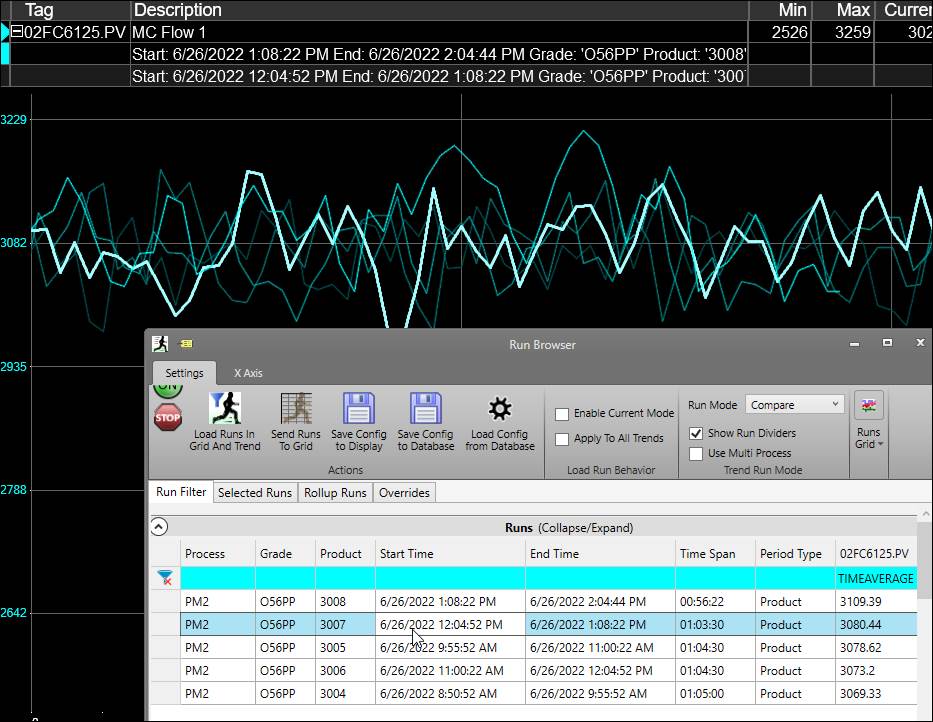
Runs Grid
The Runs Grid contains the run set generated by the Run Filter criteria, with identifying information distinguishing each run.
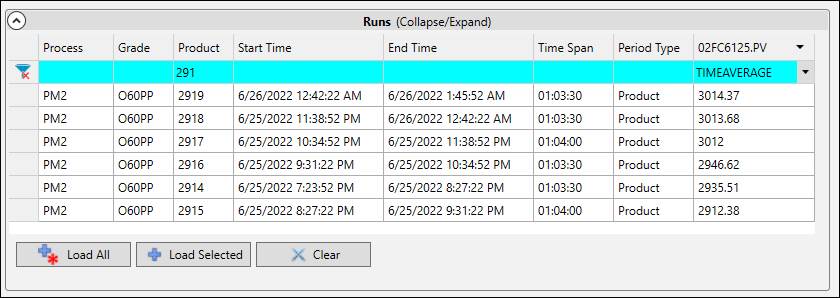
Load Runs
Runs can be loaded individually or all at once into the display.
Load Selected: Loads selected runs into the current trend. Select runs by clicking a row. Select multiple runs by holding CTRL and/or SHIFT. Runs can also be loaded by double-clicking the corresponding row or by dragging and dropping from the selected row(s) onto the display.
Load All: Loads all the runs currently in the Runs Grid to the current trend.
Clear: Clears the Runs Grid.
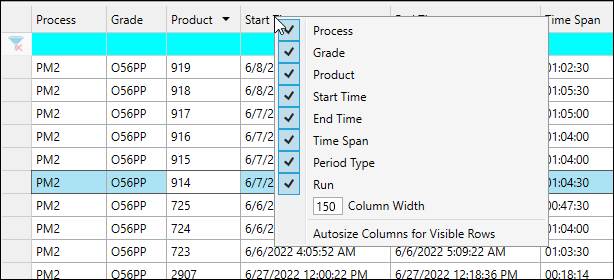
Columns
Use the top filter row to search for specific runs by column values.
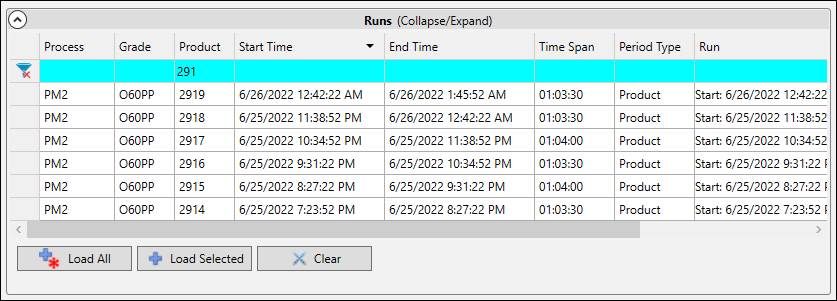
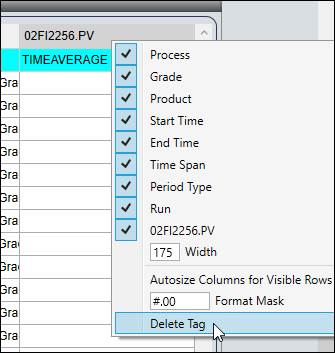
Right-click a column header to add or remove columns and to adjust the column layout.
Drag and drop and a tag to use a tag’s values for sorting. When a tag column is present, the filter row becomes an aggregate picker. Select which aggregate to calculate for the run. Click a column header to sort by values in that column.
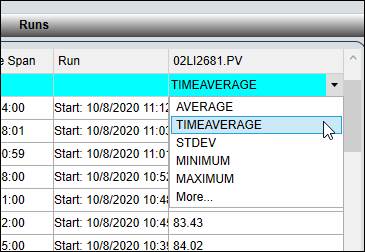
Right-click a tag column to adjust the format mask of the values shown or to delete the tag.
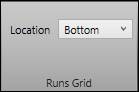
Grid Location
In Trends the location of the Runs Grid can be toggled between below and to the right of the run filter settings. For all other displays the grid appears below the run filter settings when Send Runs to Grid is clicked.
Right-Click Menu
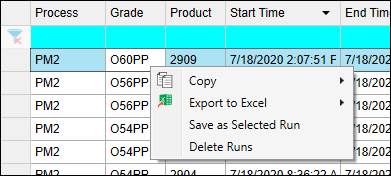
Copy Selected/All: Copies the displayed information for each run that is selected or for all runs in the grid to the clipboard. It can then be pasted into another location.
Export to Excel Selected/All: Exports the displayed information for each run that is selected or for all runs in the grid to Excel.
Save as Selected Run: Saves the selected run for use in the Selected Runs tab. If multiple runs are selected, the save prompt will appear for each run in turn.
Delete Runs: Delete the selected runs from the grid.
Highlight Runs
When a Trend is in Compare Run Mode or Batch Run Mode, the selected run is highlighted on the display. Select a run again to un-highlight it (make sure to click on a different cell).