The Rollup Data sheet is a variant of the normalized data sheet that retrieves statistics from the rollup server, averaged over an entire run. The sheet will only retrieve data for tags which are enabled in the rollup server.
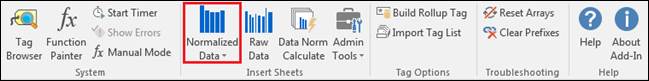
To insert a rollup data sheet, click the Normalized Data icon, then select Rollup Runs from the drop-down gallery.
To retrieve data:
Drag tags from the tag browser to the first row, starting at cell D1
For each tag, specify a statistic (row 9) to retrieve from the Rollup server
Set Start date and End date
Set a Location
Specify the desired type of runs in the Period type drop-down menu
Click the Get button
By default the sheet will only retrieve runs which start within the time range, and it will list runs by their start time. Change the Include runs setting, to make the sheet retrieve runs which end within, start and end within, or have any part within the time range. Change the Show time column as setting to make the sheet list runs by their end time.
Change the period type in the rollup settings area. Filter the runs to only include a certain grade by selecting a grade type (B15) and entering the grade name (B16). To only show runs which have no grade, select “NO GRADE”.

For each column, use the drop-down menu in row 9 to select a statistic type. Possible statistics are:
Average: Unfiltered time weighted average of the run
Rawaverage: Unfiltered raw average of the run
Count: Unfiltered count of the data points in the run
Min: Minimum value of the unfiltered data in the run
Max: Maximum value of the unfiltered data in the run
Runtime: total time of unfiltered run, in seconds
Quality: OPCHDA quality of the unfiltered data in the run
Faverage: Filtered time weighted average of the run
Frawaverage: Filtered raw average of the run
Frawstddev: Filtered standard deviation of the run
Fcount: Count of the filtered data of the run
FMin: Minimum value of the filtered data in the run
FMax: Maximum value of the filtered data in the run
Fuptime: Total time, in seconds, that the process was up for the run.
Fquality: OPCHDA quality of the calculated values of filtered data in the run
Product: If set to display Product runs or Period Type, this will show the product ID or name for that tag’s process area.
GradeName: This will show the Grade Name for that tag’s process area for the period of the run.
Calc: a calc column, just like the calc columns in a standard normalized sheet.
Each column can be a different statistic, and tags can be repeated across the top for different statistics on the same tag.