
The Range Mode determines the value range of the data displayed in the profile. Based on the selected Display Mode, the options for the Range Mode may change.
Fixed: Manually specify the value ranges and colors for the profile.
Average: Center the profile data around a filtered average. Use an absolute value range or standard deviation to determine the Min and Max for the color mapping.
Limit: Use tag limits to set the Min, Max, and Middle.
Setpoint: Center the profile data around a setpoint tag’s value. Use an absolute value range to determine the Min and Max for the color mapping.
Fixed
Configuration of the Fixed range mode depends on the selected Color Mode, Gradient or Fixed.
Color Mode: Gradient

Middle: Value around which Min and Max are centered.
Range +/-: The value to add to and subtract from the Middle to produce the Max and Min.
Color Mode Gradient: Specify exactly three colors: Upper, Target, and Lower.
Upper: Max value color.
Target: Middle value color.
Lower: Min value color.
Reverse Colors: Reverse the order of the Waterfall colors.
Color Mode: Fixed
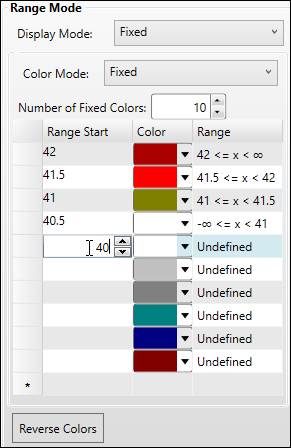
Color Mode Fixed: Use a set number of colors and corresponding value ranges. The highest value in the range will be the Max, the lowest value in the range will be the Min, and the Middle is the average of the two values.
Number of Fixed Colors: Number of color rows used to configure the value range.
Range Start: This column automatically sorts highest to lowest. Start by entering the highest in the list of values that will correspond to colors.
Color: Pick the color that corresponds to the value range.
Range: Automatically calculates the value range that corresponds to the selected color based on the values in this row and the rows above and below it.
Reverse Colors: Reverse the order of the Waterfall colors.
Average
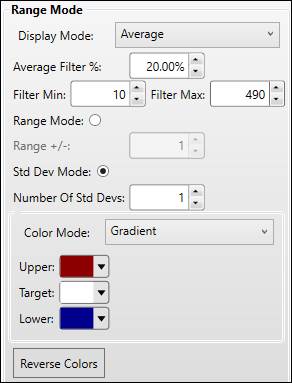
Display Mode Average: Center the profile data around a filtered average. Use an absolute value range or a number of standard deviations to determine the Min and Max for the color mapping.
Average Filter %: When calculating the average of the data for a given timespan, exclude this percentage of the data from the first and last positions in the set, divided equally between them. For example, if the 0-based array has 100 positions and the Average Filter % is 20, positions 0-9 and positions 90-99 will be excluded from the average. Note, however, that the data will still be plotted, etc., just excluded from this average calculation. The average is used to determine the Middle value in the Average Display Mode.
Filter Min: When calculating the average, exclude all values below this value.
Filter Max: When calculating the average, exclude all values above this value.
Range Mode: Use an absolute value range to center the Min and the Max around the Middle.
Range +/-: The value to add to and subtract from the Middle to produce the Max and Min.
Std Dev Mode: Use a number of standard deviations to center the Min and the Max around the Middle.
Number of Std Devs: The number of standard deviations to add to and subtract from the Middle to produce the Max and Min.
Gradient Color Mode
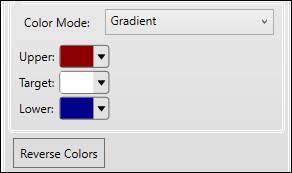
Color Mode Gradient: Specify exactly three colors: Upper, Target, and Lower.
Upper: Max value color.
Target: Middle value color.
Lower: Min value color.
Reverse Colors: Reverse the order of the Waterfall colors.
Fixed Color Mode
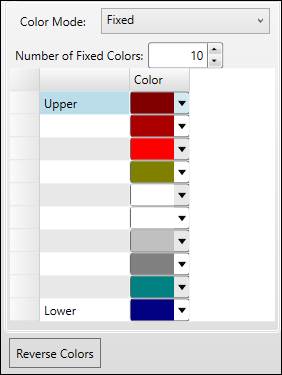
Color Mode Fixed: Map a set number of colors to the profile data. The Upper color corresponds to the Max and the Lower color corresponds to the Min. The profile values are mapped equally across whatever number of colors is set.
Number of Fixed Colors: Number of color rows used to configure the value to color mapping.
Reverse Colors: Reverse the order of the Waterfall colors.
Limit

Display Mode Limit: Use tag limits to dynamically set the Min, Max, and Middle.
Limit Type: The limit type to use.
Limit Tag: Specify the UTag that will provide the limit values. Drag and drop a tag from Tag Browser or manually specify a tag name.
Upper: Max value color.
Target: Middle value color.
Lower: Min value color.
Reverse Colors: Reverse the order of the Waterfall colors.
Setpoint

Display Mode Setpoint: Center the profile data around a setpoint tag’s value. Use an absolute value range to determine the Min and Max for the color mapping.
Setpoint Tag: Specify the UTag that will provide the setpoint value. Drag and drop a tag from Tag Browser or manually specify a tag name.
Range +/-: The value to add to and subtract from the Middle to produce the Max and Min.
Gradient Color Mode

Color Mode Gradient: Specify exactly three colors: Upper, Target, and Lower.
Upper: Max value color.
Target: Middle value color.
Lower: Min value color.
Reverse Colors: Reverse the order of the Waterfall colors.
Fixed Color Mode
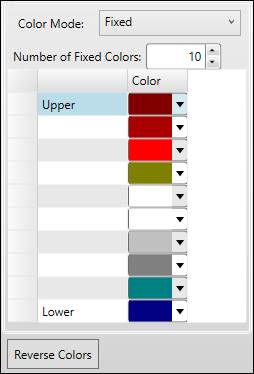
Color Mode Fixed: Map a set number of colors to the profile data. The Upper color corresponds to the Max and the Lower color corresponds to the Min. The profile values are mapped equally across whatever number of colors is set.
Number of Fixed Colors: Number of color rows used to configure the value to color mapping.
Reverse Colors: Reverse the order of the Waterfall colors.