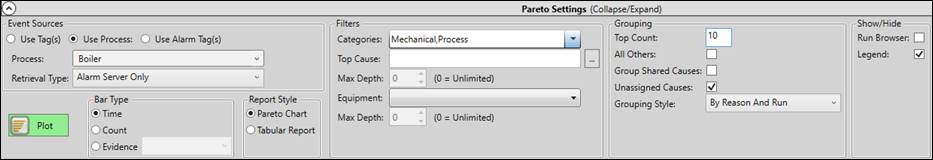
Use the Pareto Settings panel to configure the source, style, and appearance of the alarm event report.
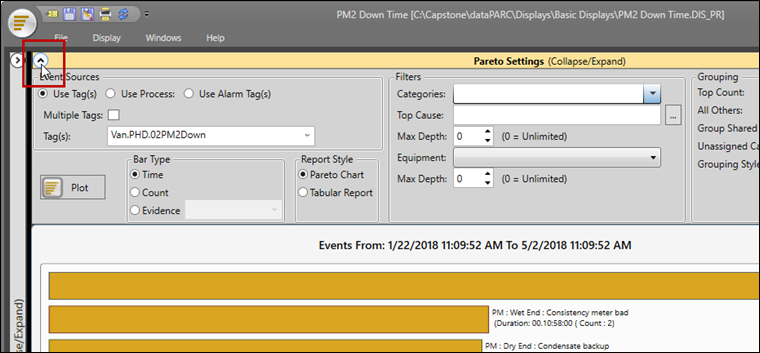
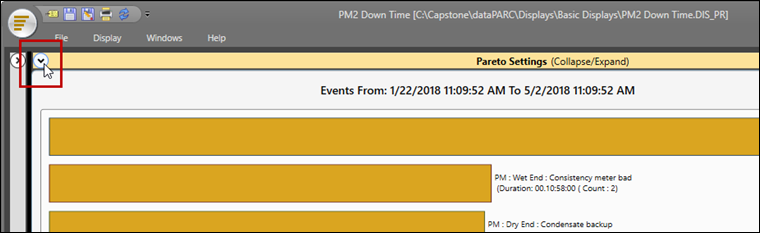
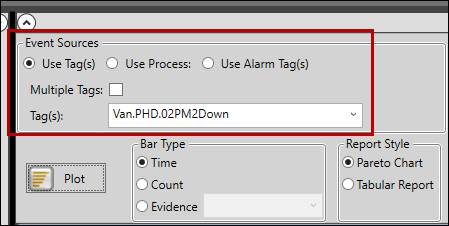
Show / Hide Pareto Settings
Click the Collapse/Expand button to show or hide the settings panel.
Plot Button
Click the Plot button to plot the Pareto chart based on current settings.
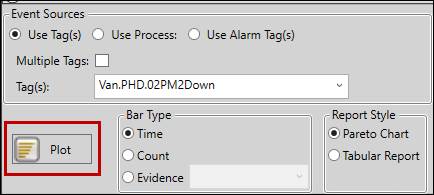
If configuration changes have been made, the Plot button will turn green to indicate that the chart needs to be re-plotted.
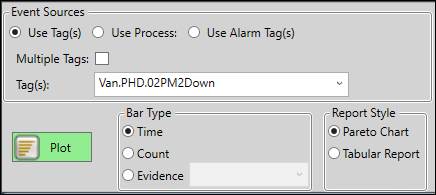
Event Sources
The Event Sources section determines the source of alarm event data. The options in this section depend on which mode is selected: Use Tag(s), Use Process, or Use Alarm Tag(s).
Use Tag(s)
Use Tag(s): In this mode, the Pareto chart will return all events associated with the tag or tags specified, including events from any alarms defined against the tag and any manually-created events, whether created from tag limit violations or created as ad-hoc events.
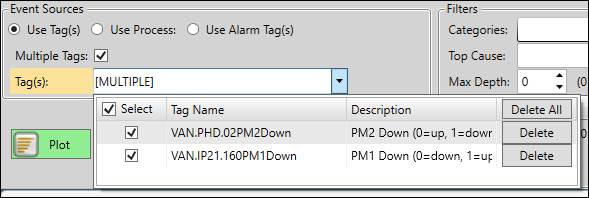
Multiple Tags: If unchecked, the Pareto chart will return events for one tag at a time. If checked, the chart can return events from multiple tags at once. This settings affects the behavior of the Tag(s) drop-down menu.
Tag(s) (Single): Select a tag as the source of event data. To add tags to the list, either drag and drop onto the chart area or into the text field. To remove a tag from the list, click the red “ X” icon.
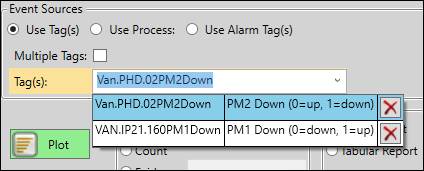
Tag(s) (Multiple): Select one or more tags as the source of event data. The chart will combine events from all selected tags. Individually check boxes in the Select column to use tags selectively, or check the box in the column header to use all tags. To add tags to the list, drag and drop into the text field. To remove tags from the list, click the Delete button, or click Delete All to remove all tags at once.
Use Process
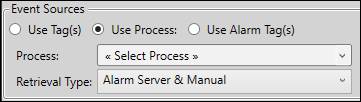
Use Process: In this mode, the Pareto chart will return all events associated with the process area specified, including events from any sub-process areas. The chart plots a bar for each tag that has associated alarm events. Clicking a bar shows event data for just the tag whose bar was clicked. Right-click and select Back to Process to return to the process area event data.
Process: Select a process area as the source of event data. Events from the selected process area and all its subareas will be returned.
Retrieval Type: Determine the type of alarm events returned. Select from Alarm Server Only, Alarm Server & Manual, or Manual Only.
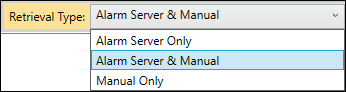
Alarm Server Only: Only return alarm events generated by PARCalarm Server.
Alarm Server & Manual: Return all alarm events.
Manual Only: Only return manually-created alarm events.
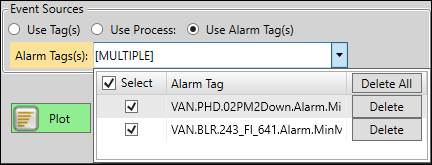
Use Alarm Tag(s)
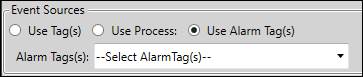
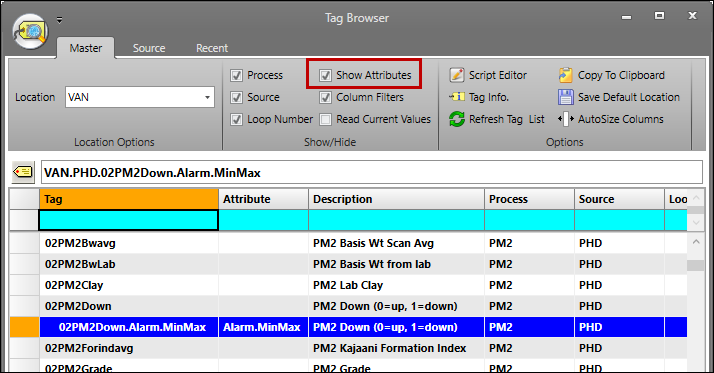
Use Alarm Tag(s): In this mode, the Pareto chart will return all events associated with the alarm tag or alarm tags specified. An alarm tag is specific to an individual alarm definition, with the syntax “Location.Source.Tagname.Alarm.AlarmName”. Locate alarm tags in Tag Browser by clicking on a tag with alarms while Show Attributes is checked.
Alarm Tag(s): Select one or more alarm tags as the source of event data. The chart will combine events from all selected alarm tags. Individually check boxes in the Select column to use tags selectively, or check the box in the column header to use all tags. To add alarm tags to the list, drag and drop into the text field. To remove alarm tags from the list, click the Delete button, or click Delete All to remove all alarm tags at once.
Bar Type
The Bar Type options control the type of data used to aggregate to the events.
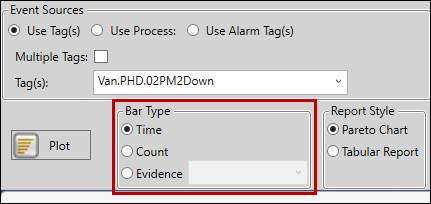
Time: The length of each bar will be determined by the total duration of the events assigned a given reason.
Count: The length of each bar will be determined by the number of events assigned a given reason.
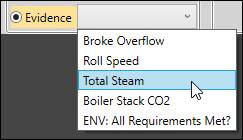
Evidence: The length of each bar will be the sum of the evidence values assigned to the events.
Report Style
The Report Style options determine whether to create a Pareto chart or a tabular report when the Plot button is clicked.
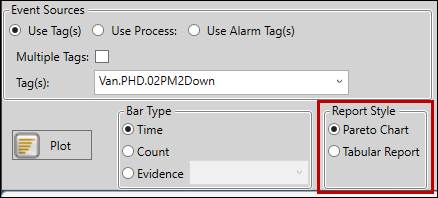
Pareto Chart: Create a Pareto chart.
Tabular Chart: Create a tabular report.
Filters
Use the Filters section to defined the filter criteria for the Pareto chart.
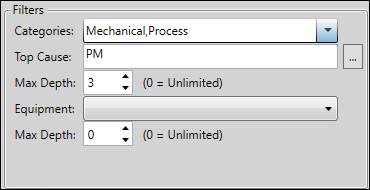
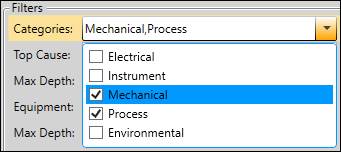
Categories: Filter the event data by the category or categories of the reasons assigned to events. Check one or more categories. Selecting none of the categories will show events for all categories. Reasons are assigned to categories in System Configuration. Note: this setting will not filter by alarm category, which is set in Alarm Configuration and used primarily in Alarm List displays.
Top Cause: Filters the event data to a specified branch of the reason tree. Select a reason from the tree, and only events with that reason or reasons below it in the tree will be returned.
Max Depth: How many levels to go down beneath the Top Cause.
Equipment: Filters the event data to a specified section of the equipment list. Select a piece of equipment from the list, and only events with that equipment or equipment below it in the list will be returned.
Max Depth: How many levels to go down beneath the Equipment filter.
Grouping
Use the Grouping section to determine how events are grouped together in the report.
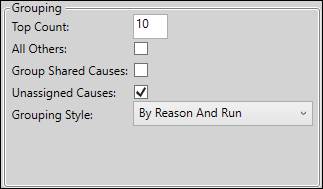
Top Count: The highest number of unique reasons to include in the report, sorted highest to lowest based on the Bar Type (count, duration, or sum of evidence). All events assigned to other reasons will be combined in an All Others group if All Others is checked.
All Others: Include all events outside of the Top Count in an All Others tab.
Group Shared Causes: Group shared reasons together.
Unassigned Causes: Include events without an assigned reason.
Grouping Style: Determine the grouping style of the report. Note: The By Reason And Run and By Run options make more sense with event data that comes from multiple runs (timespans), but all grouping styles can be used with event data from either a single timespan or multiple runs.
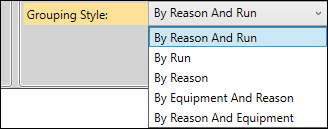
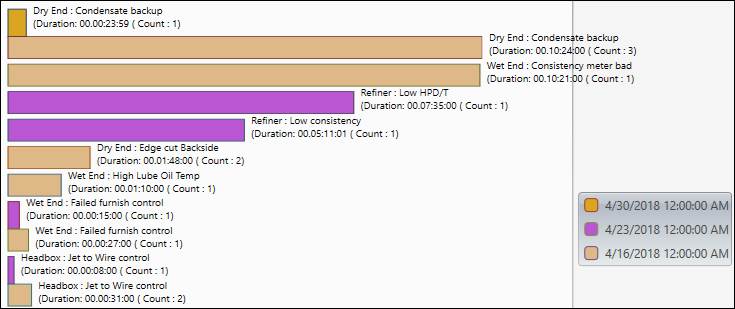
By Reason and Run: Group events by reason and then by run. Each reason gets its own set of bars, with a bar for each run.
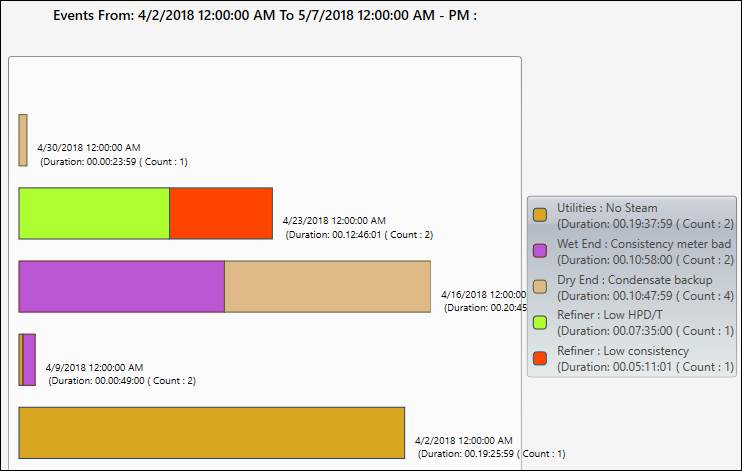
By Run: Group events by run. Each run gets its own bar, and the bar is segmented by reason.
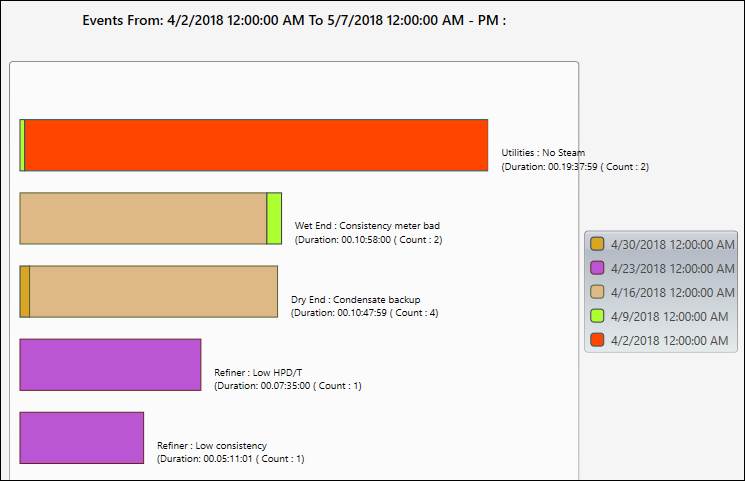
By Reason: Group events by reason. Each reason gets its own bar, and the bar is segmented by run (if there are multiple runs).
By Equipment and Reason: Group events by equipment and then by reason. Each piece of equipment gets its own set of bars, with a bar for each reason.
By Reason and Equipment: Group events by reason and then by equipment. Each reason gets its own set of bars, with a bar for each piece of equipment.
Show/Hide
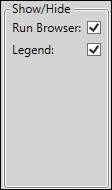
Run Browser: Toggles the visibility of the Run Browser.
Legend: Toggles the visibility of the Legend.