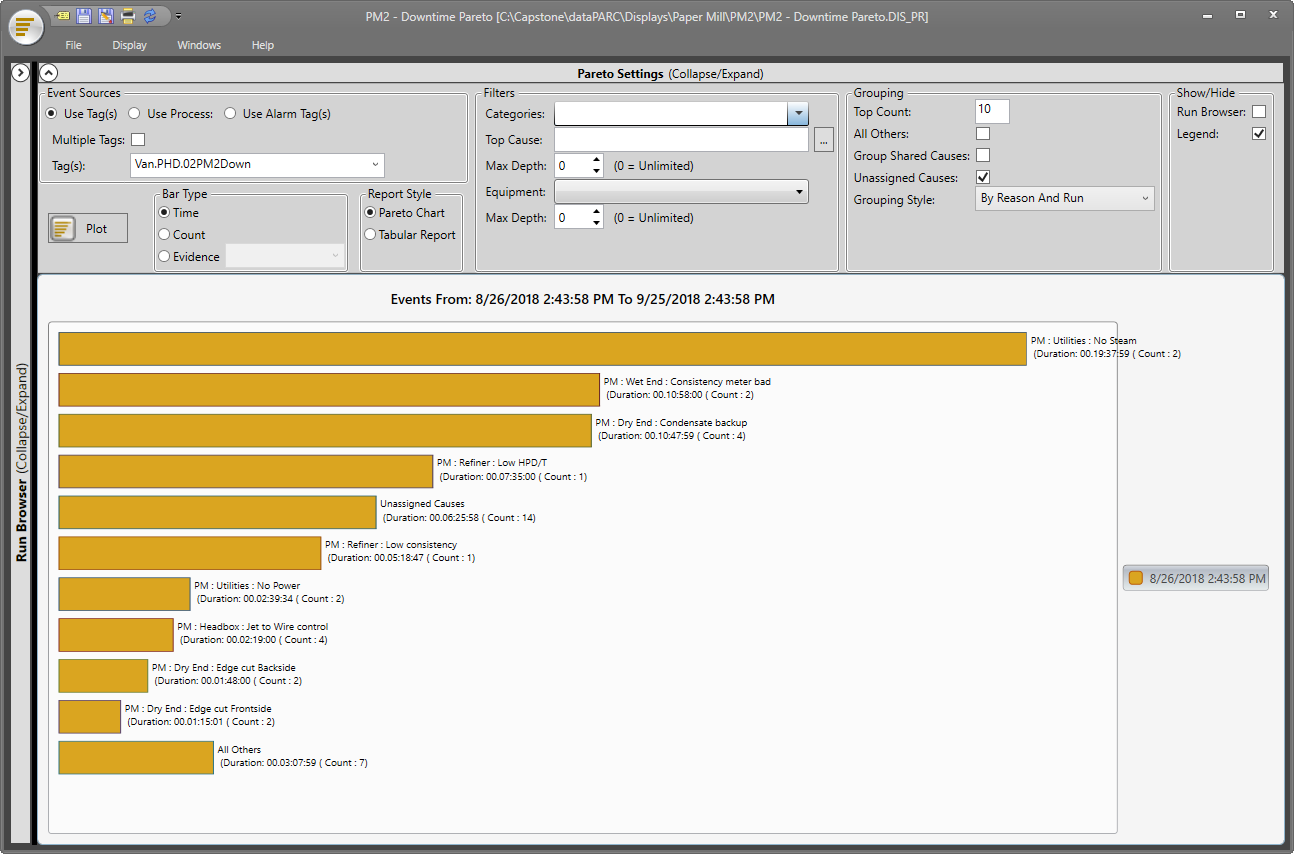
A Pareto chart is a type of alarm event report that summarizes alarm event data by assigned reason. These events can be grouped by reason, time period, and/or equipment. Filter criteria can further refine the report.
Pareto charts are a tool for root cause analysis, designed to help identify the assigned Reason that results in the most events or the most event time.
The report can pull events from a single tag, from a set of tags, from a process area (including subareas), or from one or more alarm tags.