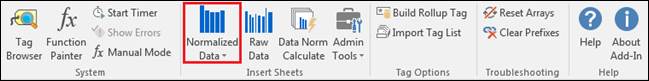
A Normalized Data Sheet is a preconfigured sheet used to query for an array of data for a set of tags. Filters, calculated columns, and integrated statistics provide tools for analysis. To make a new Normalized Data Sheet, click the shortcut button on the dataPARC Add-in Ribbon.
To populate data, tags must be inserted to the sheet. Open the Tag Browser and find the desired tags. Either insert a group of them by dragging them to cell D1, which will auto populate the row, or drag them individually to row 1 starting at column D.
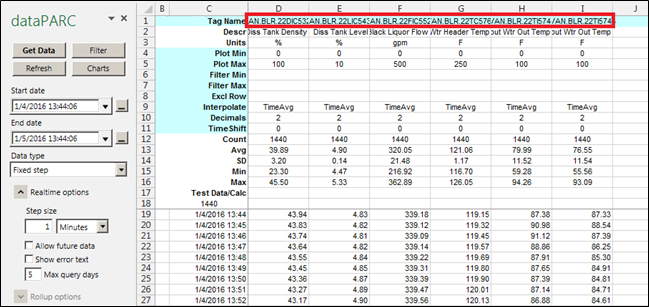
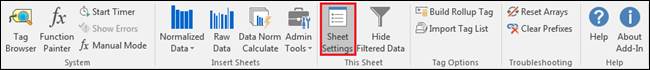
The settings pane (dataPARC) is shown by default on new Data Normalize sheets. If it is not visible, click Sheet Settings on the Ribbon.
The required inputs to retrieve data are:
Start date: The first timestamp
End date: The final timestamp
Data type: The type of data gathered in the sheet. The options are Fixed Step (standard), Manual, Rollup Data, and Alarm Events.
Step size: The amount of time between data points.
Allow future data: Allows the sheet to display data from timestamps into the future. This can be useful for different time zones or any source that contains future data.
Show error text: If checked, empty data points will display “#NoData”. Otherwise, the cell will be left blank.
Max query days: The maximum data timespan (in days) that can be gathered at one time. Will still get all the data between Start and End, but will only ask the historian to retrieve this much data at a time. Helps with performance when asking for large sets of data.
These inputs will auto populate to defaults upon opening the sheet. The default start and end time are set to retrieve data from the last 24 hours, and the default Step is 1 minute time weighted averages. See the Retrieving Data section for how to populate the sheet once these inputs are complete.