Curve Fit
- 01 Feb 2024
- 印刷する
- PDF
Curve Fit
- 更新日 01 Feb 2024
- 印刷する
- PDF
The content is currently unavailable in Ja - 日本語. You are viewing the default English version.
記事の要約
この要約は役に立ちましたか?
ご意見ありがとうございます
The curve fit section is used to plot curve fit lines on the chart.
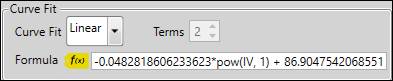
Curve Fit: Various types of formulas can be plotted on the chart to describe the relationship between the X-tag and Y-tag. Select a formula type from the Curve Fit menu. The Polynomial, Exponent, Logarithmic, Power, and Fourier Curve Fits can use a custom number of terms.
Formula: The Formula field shows the resultant equation. The Formula and the R-Squared are shown in the Legend and Stats Grid.
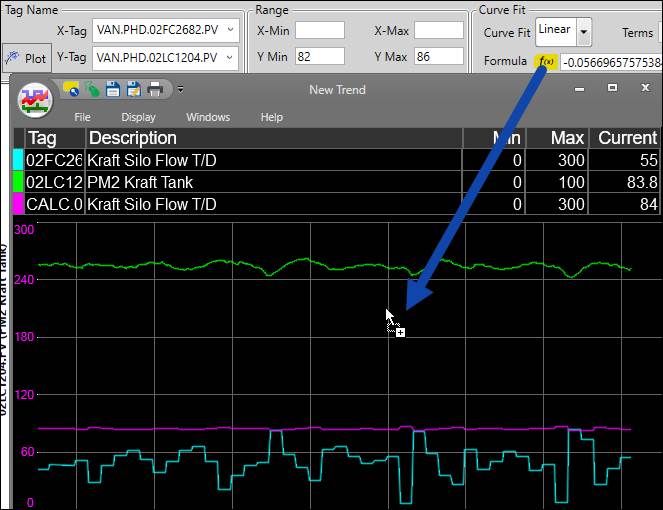
To trend the formula as a calculation of the X-tag, click and drag the tag icon onto a Trend.
この記事は役に立ちましたか?