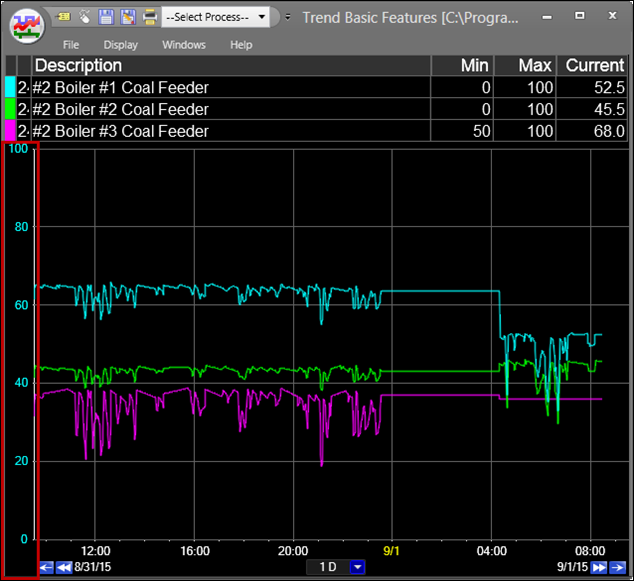
The Trend’s Y-axis displays the value ranges for the tags in the trend. Each tag is plotted independently with its own value range, shown in the Min and Max fields of the Tag Info Grid. By default, the values shown on the Y-axis are for the tag selected in the tag grid, but it can be configured to show value ranges for all tags or for no tags.
Y-Axis Right-Click Menu
Right-click the Y-axis to open the context menu.
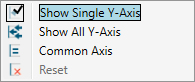
Show Single Y-Axis: Show the value range for one tag at a time. The range shown is for the tag selected in the Tag Info Grid.
Show All Y-Axis: Show values ranges for all tags. Though this takes up more screen real estate, it is more useful for printing and screen shots.
Common Axis: Force all tags to use the same value range while still fitting all values within the plot area.
Reset: Reset the Y-axis to its initial state.
Change Y-Axis Values
To change the value range of a tag, modify the Plot Min and Max properties in the Tag Info Grid.
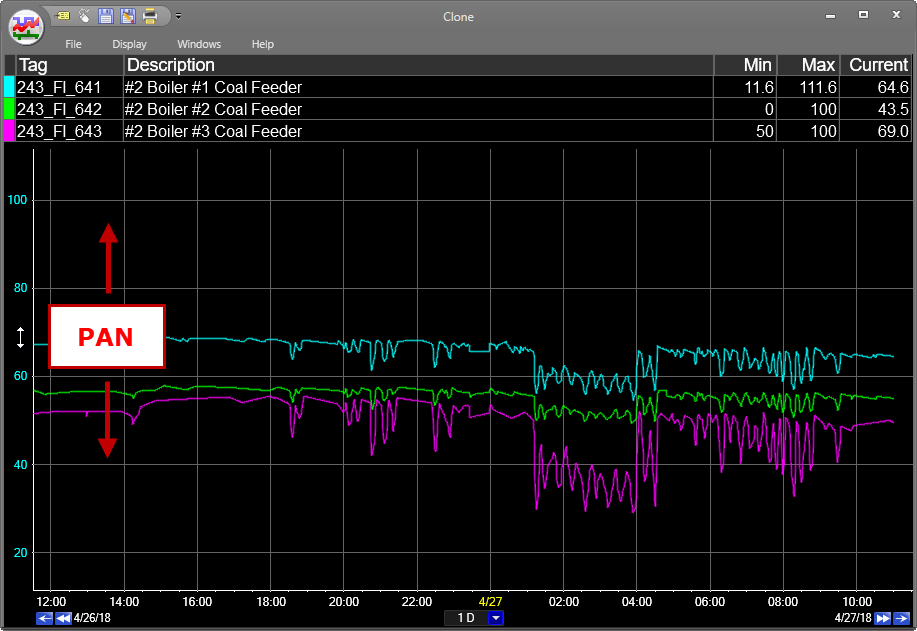
The value range can also be manually adjusted. Click and drag the Y-axis to pan up and down. This also works for individual tags when showing value ranges for all tags.
If your mouse has a scroll wheel, scroll up or down to narrow or widen the value ranges of all tags at once.
To automatically fit the Y-Axis to accommodate all tag values in the trend, use the Auto-Scale feature.