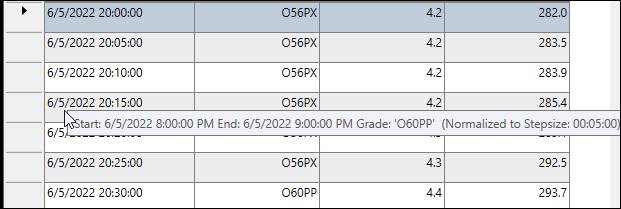
Purpose: Learn to look at tag data normalized to run length and to a step size in a Tabular Chart.
Task: Open a Tabular chart by launching it from a Trend. In the Tabular chart, use the Run Browser to retrieve time averages for all runs of a given type over the last four weeks, normalized to the length of each run. Then, switch to normalizing to a step size of one day.
Steps:
Open an existing Trend.
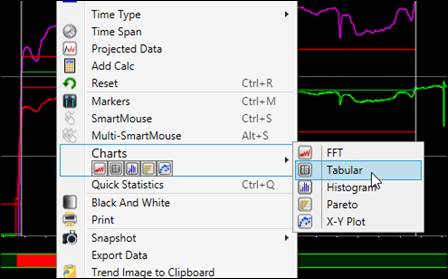
Right-click the plot area and choose Charts ->Tabular.
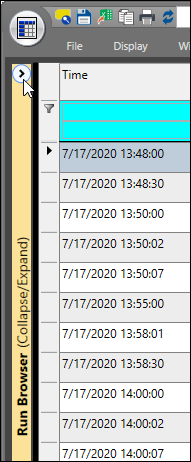
Expand the Run Browser by clicking on the ( Collapse/Expand) button.
On the Run Filter tab, select Multiple Runs for Process and Period as the time period source. The Location / Process Period Type and Filter Runs By sections will appear. Set the process are to the process area of the tags. If the selected process is grade-based, the Grade Filter section will also appear.
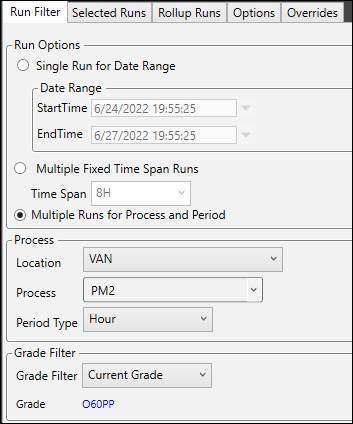
Set the Period Type to the desired type of run.
If the selected process area is grade-based, set the Grade Filter as desired.
Set the Run Selection method to Date Range. Use the calendars to set the Start and End. Depending on the selected period type, select a timespan that will produce the desired number of runs.
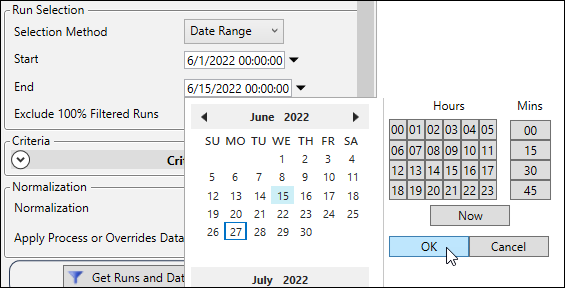
For the Normalization choose To Run.

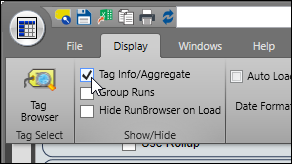
On the Display tab check Tag Info/Aggregate.
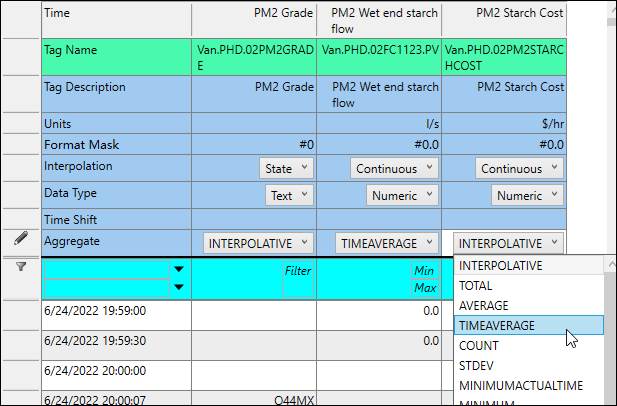
Select TIMEAVERAGE in the Aggregate menu for the tag columns to see a time-weighted average for the selected period type.
Back on the Run Browser panel, click Get Runs and Data.

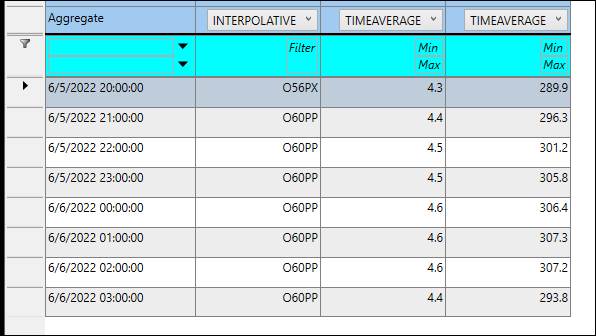
On the Run Filter tab change the Normalization to Step Size and enter 5M. Click Get Runs and Data.

After data loads, hover the mouse over the grid to see the ToolTip for each row.
