Purpose: Learn to use the Criteria grid to divide a date range into runs using tag values.
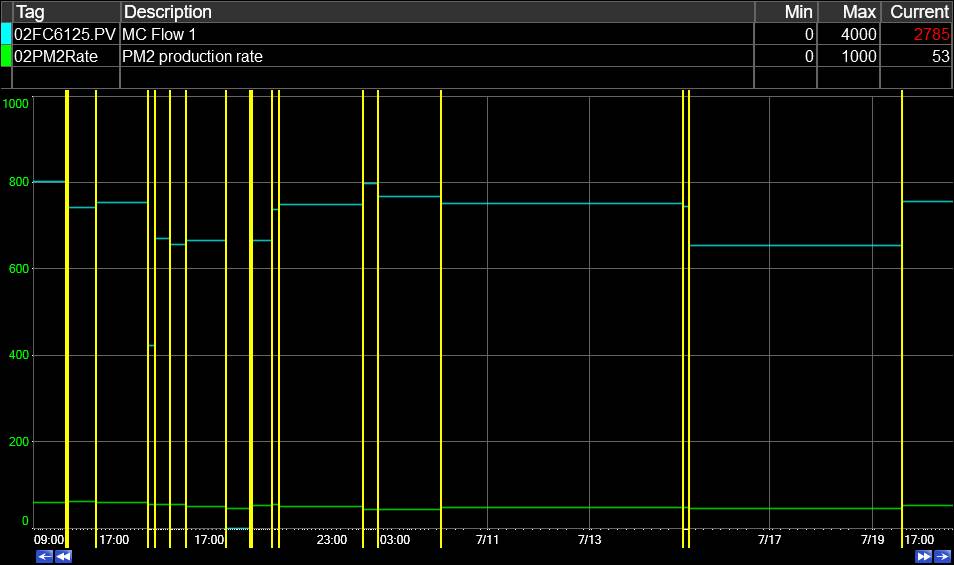
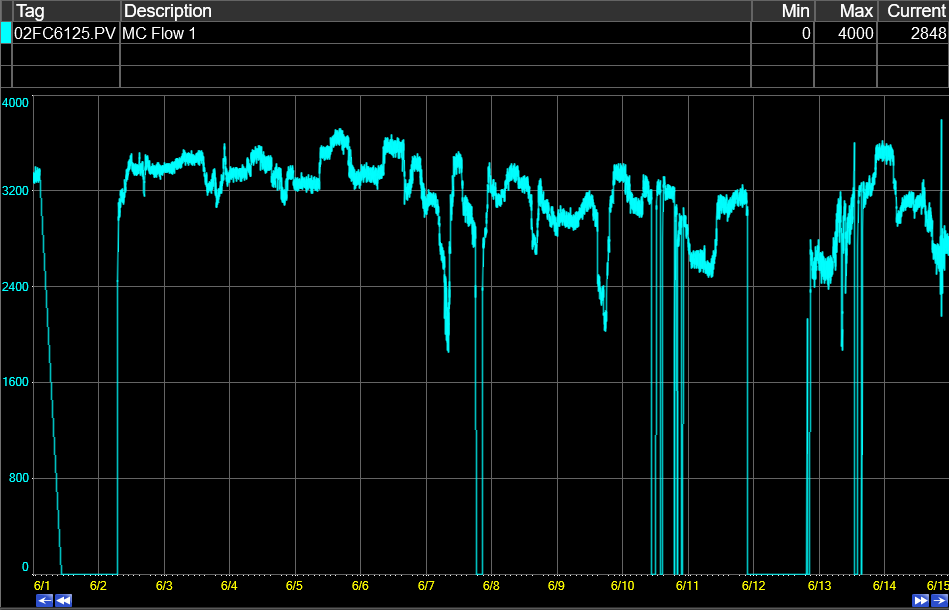
Task: Use the Trend’s Run Browser to divide a date range into runs using the Criteria grid. Add a tag and divide runs when the tag’s values meet the specified condition, for example when the value is greater than zero. Send the runs to the grid, then load them in the Trend. Try out using a Trend in run mode.
Steps:
Create a Trend with at least one tag.
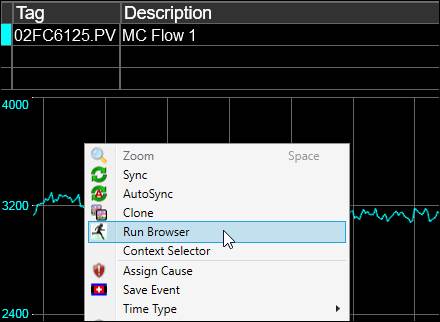
Right-click the plot area of the Trend and choose Run Browser.
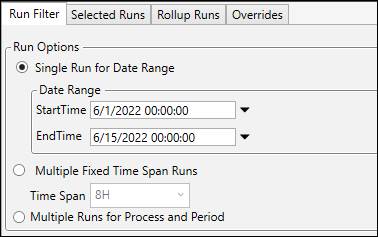
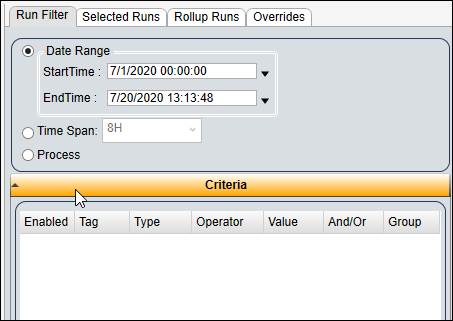
On the Run Filter tab, select Single Run for Date Range as the run source. Use the calendars to set the start and end times.
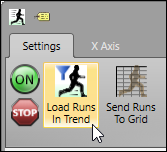
On the Settings ribbon, click Load Runs in Trend to preview the date range.
Next, expand the Criteria section.
Open Tag Browser. Choose a tag to use as the run divider tag. This tag’s values will be used to determine the run times. It is helpful also to add the tag to the trend, but not necessary.

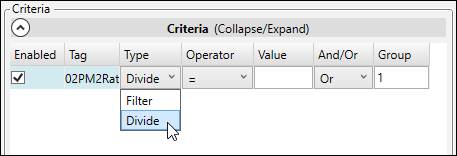
Change the Type to Divide.
Select an Operator. This determines how that tag’s values will be compared to the specified value (with the exception of Change, see Criteria). In this example, the goal will be to create run times when the divider tag’s values are greater than zero. In other words, this will remove all time when the tag’s value is zero or less.
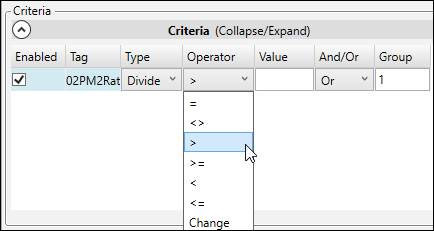
Enter “0” (zero) in the Value field.

Click Send Runs To Grid. Here you can preview the runs that are generated before loading them and choose which runs to load. Click Load All or choose one or more runs and click Load Selected.

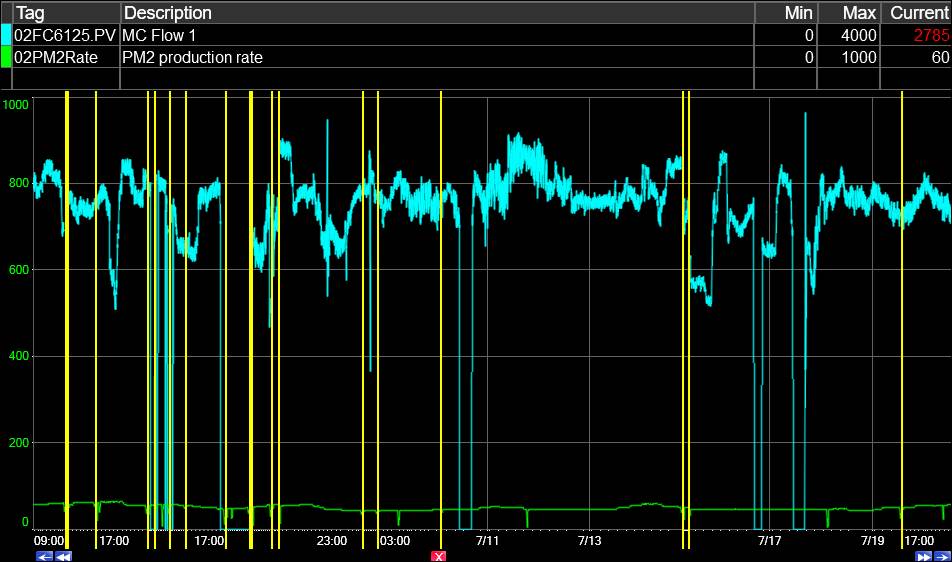
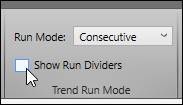
Try unchecking Show Run Dividers.
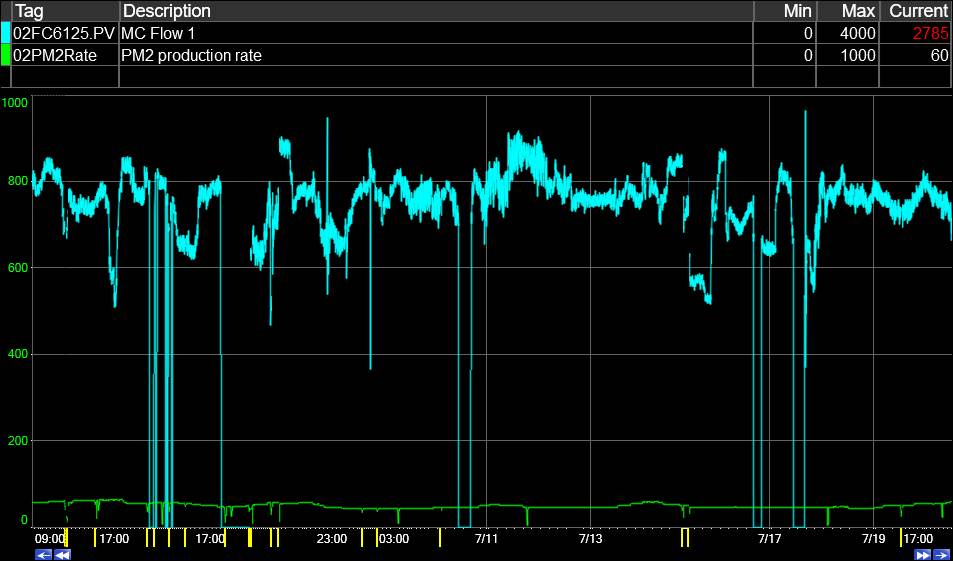
While in run mode, the Trend’s Zoom feature works for individual runs. Also, instead of cloning the whole trend, double-clicking a run will launch a trend of that timespan. Try both.
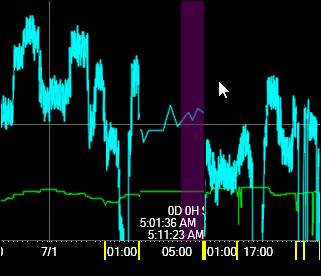
To delete a run, right-click the time axis. The selected run is highlighted in red.

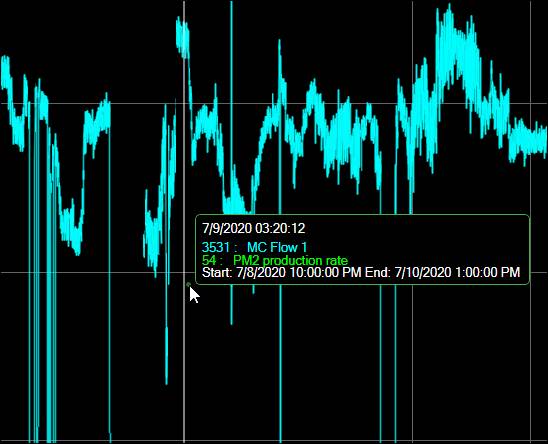
Use SmartMouse to view run information.
Back in the Run Browser, change the Normalization to To Run. Leave the Aggregate as Time Average. This setting will show a single tag value per run that is the time-weighted average of the tag’s values over the length of the run.

