The Tag Statistic function (fnTagStat) calculates a statistic about a tag for a given time interval.
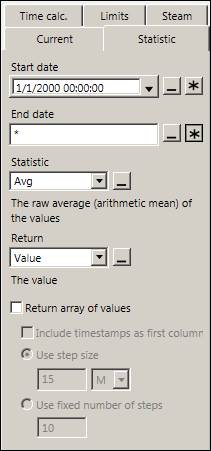
By default, it returns the average value of the tag over the last 24 hours (fixed). To change, select each date in one of the following ways:
Manually enter a fixed date
Click
 to select a fixed date using the calendar
Click
 to select a cell reference or formula
Click
 to manually enter a time shortcut
Time shortcuts are expressions specifying a non-fixed date. The following styles of time shortcut are allowed:
* for the current date and time
T for the start of the current day
Y for the start of the previous day
* +/-[time] or T+/-[offset] or Y+/-[offset] for a moving average. Offsets are strings of numbers and units. Valid offset units are S (seconds), M (minutes), H (hours), D (days), W (weeks), MO (months), and Y (years).
Period:[name] and PeriodEnd:[name] for the start and end of the current or latest of the specified period
Period:[name]:-[offset] and PeriodEnd:[name]:-[offset] for the start and end of a previous period. Offsets are whole numbers.
The following table shows some examples of time shortcuts:
Start | End | Meaning |
*-1H | * | The past hour (moving average) |
* | *+1H | The next hour (projections) |
*-6H30M | *-2H | From 6 hours 30 minutes ago to 2 hours ago |
Y | T | Yesterday |
T+6H | * | From 6:00 today to the current time |
T | * | From midnight to the current time |
Period:D | PeriodEnd:D | The current day |
Period:D:-1 | PeriodEnd:D:-1 | The previous day |
Period:Crew-A | PeriodEnd:Crew-A | The current Crew-A period if Crew-A is current, or the last Crew-A period if not |
Period:Crew-A:-1 | PeriodEnd:Crew-A:-1 | The last Crew-A period if Crew-A is current, or the Crew-A period before last if not |
In formulas, time shortcuts become strings. For example, a one-day moving average ( *-1D to *) would yield:
=fnTagStat("LOC.SRC.TAG", "*-1D", "*", "TimeAvg")
Time shortcuts cannot be used if returning an array.
Select a Statistic from the drop-down menu or use a cell reference to determine the aggregate type:
Avg*: Arithmetic average of the tag over the step size.
TimeAvg*: Time weighted average of the tag over the step size.
TimeAvg2*: Same as TimeAvg but does not carry forward the last known good quality point across a bad quality timespan.
Linear: Linearly interpolates the tag’s value at the time step
Min: The minimum value of the tag over the step size.
Min2: Same as Min except it includes interpolated bounding values.
MinAtTime2: The Min value and the timestamp.
Max: The maximum value of the tag over the step size.
Max2: Same as Max except it includes interpolated values.
MaxAtTime2: The Max value and the timestamp.
Count: The count of the actual values of the tag over the step size.
SD: The standard deviation of the tag over the step size.
Sum: The sum of all the actual values of the tag over the step size.
Start: The first value of the tag over the interval.
End: The last value of the tag over the interval.
Total: The TimeAvg aggregate multiplied by the step size in seconds.
Total2: The TimeAvg2 aggregate multiplied by the step size in seconds.
DurationGood: The duration of the time interval, in seconds, that the quality of the tag was good.
DurationBad: The duration of the time interval, in seconds, that the quality of the tag was bad.
PercentGood: The percent of the time interval that the quality of the tag was good.
PercentBad: The percent of the time interval that the quality of the tag was good.
Delta: The earliest value subtracted from the latest value.
*the –Qual option for these interpolation types returns the quality number for that interpolation type. If the Decimals row (row 10) is set to text, this will bring back the text string for the quality.
If needed, specify the type of data to return from the Return drop-down menu:
Value: The value
Time: The value’s timestamp
TimeValue: A 1×2 array with the value’s timestamp at left and the value at right
TimeValueVertical: A 2×1 array with the value’s timestamp at top and the value at bottom
Qual: The value’s OPCHDA quality in decimal format
QualStr: The value’s quality in text format
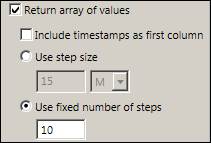
To return an array of aggregate values over the function’s interval, check Return array of values. This will enable the array options:
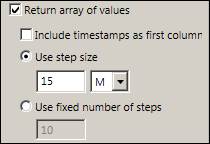
Enter a Step size and select seconds, minutes, hours, or days in the Units drop-down menu. The default step size is 15 minutes. Check Include time stamps as first column to create a two-column array, with the values’ timestamps in the first (left-side) column. Select Use fixed number of steps and enter a value to divide the function’s interval into a specific number of steps.
The timestamps selected by the steps start at the function interval’s start time but do not include the end time. In other words, the steps are start-time based. Click OK. The function can be viewed in the formula bar.