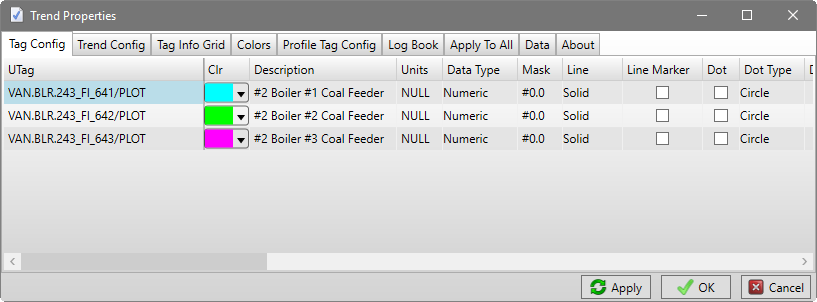
The Tag Config tab of Trend Properties contains options for configuring how tag-specific options. The UTag column will remain fixed in position while scrolling left-to-right so that the tag names are always visible.
Tag Info Grid Options
These columns provide more options for how tags are displayed in the Tag Info Grid. Click in a field to modify a property. Note that these changes do not affect the tag in its native source or the dataPARC configuration database, but are only saved with the Trend.
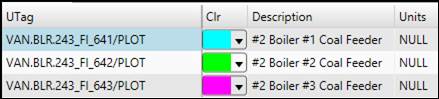
UTag: The full name of the tag along with any tag switches. This field cannot be modified.
Clr: Trend line color. Clicking on the drop down arrow opens a color picker.
Description: The description of the Tag. This is displayed in the Tag Info Grid. This does not change the permanent database description. It provides the ability to create a clearer description on an individual display.
Units: Tag’s units of measurement. Units can be shown in the Tag Info Grid by checking Units in the Tag Info Grid properties.
Trend Line Options
These options control how a tag’s trend lines appear on the plot area.
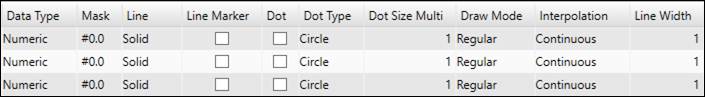
Data Type: Whether tag data is numeric or text. By default this setting is pulled from the tag source or determined by the trend.
Numeric: Tags with numbers for values.
Text: Tags with text strings for values. The Trend draws a vertical line at each point, with an optional label to show the text value.
Digital Text: For tags that have an array of two values at each timestamp, a numeric value (0 or 1) and a corresponding text value. Depending on the data source, the tag switch /digital=numeric or /digital=text can be used to force one or the other data type.
Mask: A mask for the Current column in the Tag Info Grid, the SmartMouse value, and the Show Value Text. Format masks are primarily used to determine the number of significant figures displayed for a numeric value. The syntax is “0” for a forced digit and “#” for an unforced digit. The default mask is determined by the default plot minimum and maximum for a given tag.
Line: How the line is drawn on the trend. This is primarily used when printing black and white to distinguish between trend lines. The available line types are solid, dashed, dotted, dot dash dot, and no line.
Line Marker: Adds a dot at the intersections of the trend line and the grid lines. Also adds a line marker icon based on the selected dot type in the color box of the corresponding tag in the tag info grid. This feature is designed to help users match tags to trend lines when printing in black and white or in cases of color blindness.
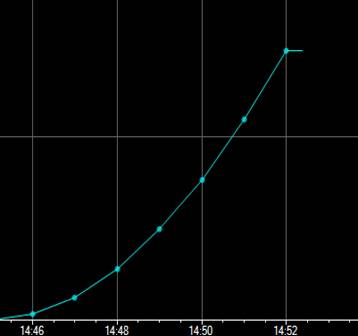
Dot: Toggles showing dots for each value.
Dot Type: This setting allows the user to change the shape of the dots on the trend.
Dot Size Multi: The size of the dot.
Draw Mode: How trend lines are drawn. See Draw Mode Options.
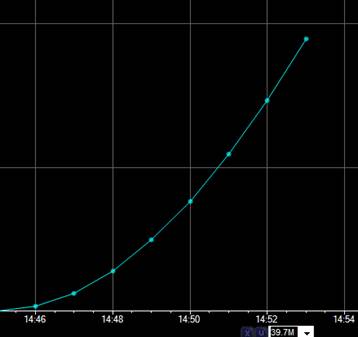
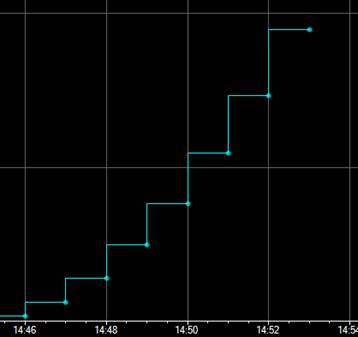
Interpolation: How the trend interpolates values between points. This setting affects the values shown on SmartMouse between points and Quick Statistics calculations.
State: Hold the value of the previous point between points.
Continuous: Linearly interpolate values between points.
Manual: When normalizing to a manual tag, interpolate values at times when this tag has values. In this case and otherwise, behaves the same as State.
Line Width: The width of the line on the trend.
Draw Mode Options
These are the draw mode options for trend lines.
Regular: Draws a direct line from point to point, extending the line from the last data point to the current time.
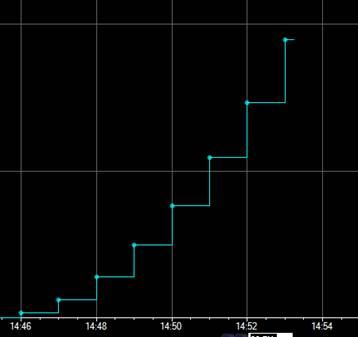
Square: Draws a horizontal line from one reading to the next. Draws a vertical line to the new value when the original value changes.
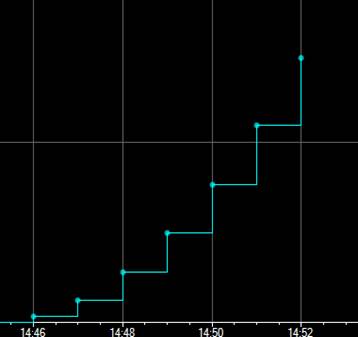
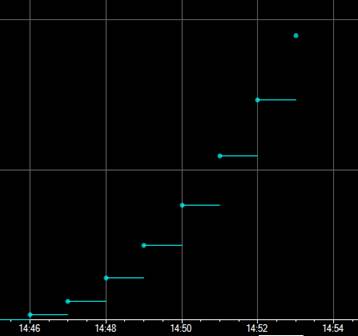
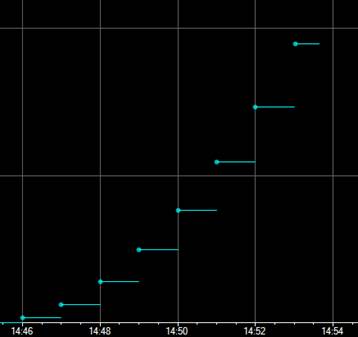
Square No Edge: Draws a horizontal line from one reading to the next, building over time. When the value changes, start drawing a horizontal line from the new point.
State: Draws a horizontal line from one reading to the next, extending the line from the last data point to the current time. When the value changes, start drawing a horizontal line from the new point. The last reading will be projected to the current time for updates. Draw a vertical line between horizontal lines.
State No Edge: Draw a horizontal line from one reading to the next, extending the line from the last data point to the current time. When the value changes, start drawing a horizontal line from the new point. The last reading will be projected to the current time for updates.
Exception: Draws a direct line from point to point, but does not extend past the last data point.
Square YX: When a new point comes in, draws a vertical line for the value change and a horizontal line for the time interval. Square YX does not extend past the last data point.
Value Range Options
These options control how a tag’s value range (Y-axis values) are determined.
Y Min: The minimum value of the Y-Axis.
Y Max: The maximum value of the X-Axis.
Range Options: How value range is determined.
None: Y-axis range is determined by the Plot Min and Plot Max of the tag.
Current: Y-axis range is centered on the tag’s current value while keep the difference between the Plot Min and Plot Max.
Target: Y-axis range is centered first on the tag’s Target Limit, either the currently enabled limit or the specified Range Limit Type. If no Target limit is found, then the tag’s Box and Whisker Target is used. If neither target is found, the y-axis is centered on the tag’s current value. If both multiple targets are enabled, the Control Target Limit takes precedence.
Limit: Y-axis range is scaled so that the Plot Min and Max just above and below the tag’s Upper and Lower Limits. Only the most current limits are evaluated in this mode.
All Limits: Y-axis range is scaled so that the Plot Min and Max are just above and below the tag’s Upper and Lower Limits. All limits are evaluated in this mode, so the Plot Max is just above the Upper Limit with the greatest value, and the Plot Min is just below the Lower Limit with the lowest value.
Limit SIGMA: The Trend first evaluates the difference between the Target Limit and the Upper Limit of the tag, and then adds a third of that value to the Upper Limit to get the Plot Max. The same logic applies in calculating the Plot Min.
Range Limit Type: Which limit type to use for the Limit and Target range options, if applicable.
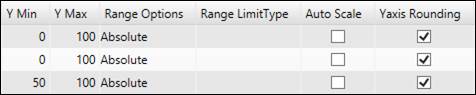
Auto Scale: Changes Y-Axis scale based on minimum and maximum values in the trend. This can also be toggled in the Tag Info Grid Right-Click Menu.
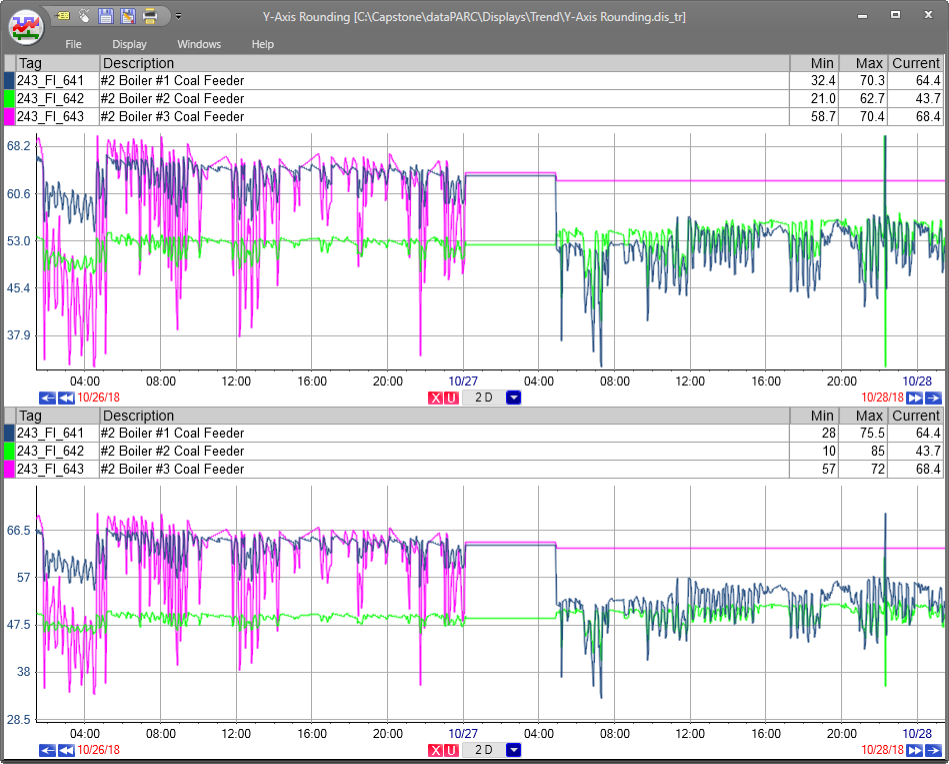
Y-Axis Rounding: When Auto Scale is enabled, the Trend will select a Plot Min and Max that nicely accommodate the value range spatially. In the example below, Y-Axis rounding is not enabled on the top trend and enabled on the bottom trend. Regardless of the Auto Scale or Y-Axis Rounding settings, the Trend will try to limit the number of decimals in the Y-Axis label values.
Labels
The label options control how text-type tags are configured to display values. When labels are enabled, text values are shown directly on the Trend.
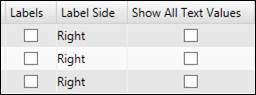
Labels: Whether to show text value on trend. Text-type tags have this enabled by default.
Label Side: Shows text value to left or right of each data point. The Label Side defaults to Right.
Show All Text Values: Shows a value and timestamp for all data points on the tag, including data points that have not changed since the previous point.
Delta Time Expression
The Delta Time properties are used to time-shift tag values.
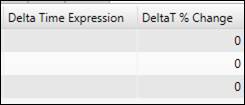
Delta Time Expression: The duration (in seconds) of time-shift the tag. The M (minutes), H (hours), and D (days) units can be used. A tag’s values can also be used as the source of the time-shift. Click the drop-down to open the Tag Browser (note tag name must be pasted into the field).
Delta Time % Change: If using a tag for delta time expression (most likely a calculated tag), the percent change between points that must be exceeded before updating the value of the time shift. Defaults to 5.
Target Lines
Use Target Lines to create custom horizontal “guide lines” on the Trend. Note that these are visual indicators only and do not behave like tag limits.
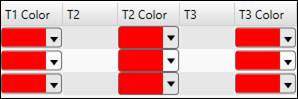
T1 :Y-Axis value at which to draw horizontal color.
T1 Color:Color of Target Line 1. Click the drop-down button to open color editor.
T2:Y-Axis value at which to draw horizontal color.
T2 Color:Color of Target Line 2. Click the drop-down button to open color editor.
T3:Y-Axis value at which to draw horizontal color.
T3 Color:Color of Target Line 3. Click the drop-down button to open color editor.