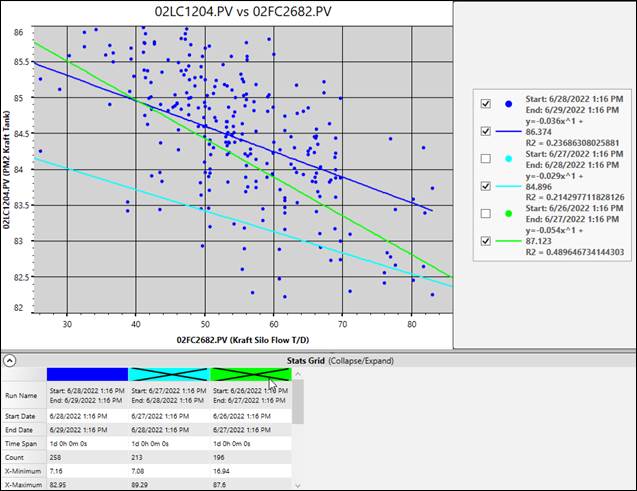
The Stats Grid is a collapsible section of the plot area that shows information about the dates, times, X and Y averages, ranges, and standard deviations of the X/Y chart data. When a Curve Fit is selected, the formula and R-Squared field will be filled as well.
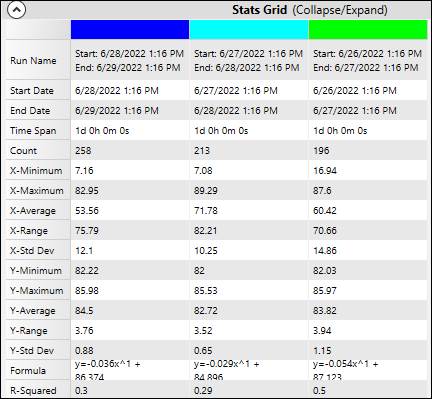
With only a single run, the Stats Grid shows the same information as the Legend. When the X/Y chart contains multiple runs (more than one span of time), each run has its own column. Right-click the colored header of a column to hide the plot for that tag.