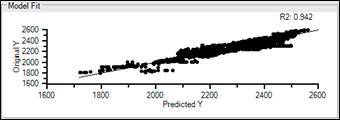
Model Fit (PLS Only)
The Model Fit section displays a graph of the Y variable’s predicted value vs its real value.
The R2 value, also known as the coefficient of determination, is a number 0 to 1 that measures how closely the model matches the real data.
Models with an R2 value of 1 perfectly match the data, while those with a value of 0 do not match the data at all.
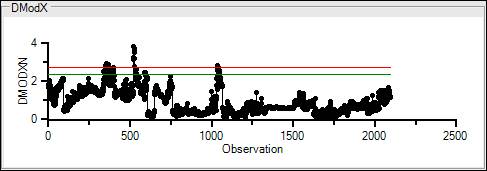
Distance to the Model of X-Space
Distance to the Model of X-Space (DModX) is the distance a data point is from the model. It is a measure of the error of the model. A high DModX indicates a poor fit of the model to the data.
The x-axis is the observation, i.e. the data point. The y-axis is Normalized DModX (DModXN), or DModX divided by its standard deviation.
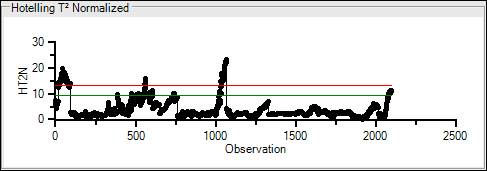
Hotelling T 2 Normalized
The Hotelling T^2 Normalized (HT2N) is the distance from the process mean the data point is, divided by the standard deviation. It measures the number of standard deviations the data point is from the process mean. High values of HT2N indicate that the data may be an outlier.
The x-axis is the observation, i.e. the data point. The y-axis is HT2N, or the number of standard deviations the observation is from the process mean.
Model Variables
The Model Variables section contains information and statistics regarding the variables in the model. It also includes options for manipulating what data PARCmodel uses.
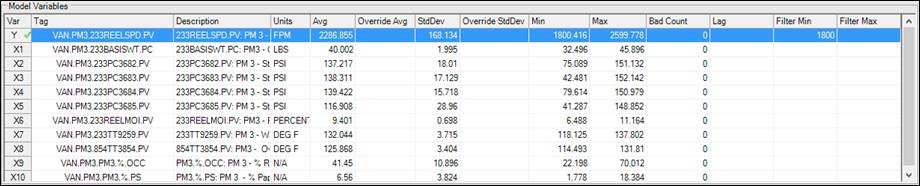
Var: The variable representation assigned to the tag.
Tag: The tag identifier.
Description: The description of the tag.
Units: The units the tag is measured in.
Avg: The algebraic average of variable’s data set normalized using the configuration in the Model Interpolation section in the Home ribbon.
Override Avg: Allows entry of an average, which takes place of the previous PARCmodel calculated average.
StdDev: The standard deviation of the tag data.
Override StdDev: Allows entry of a standard deviation, which takes place of the previous PARCmodel calculated standard deviation.
Min: The minimum value in the data set of the tag.
Max: The maximum value in the data set of the tag.
Bad Count: The number of bad quality data points present in the data set. If any tag data has bad quality, no tag data with that timestamp will be included in the model.
Lag: This column allows entry of a time lag. The time stamps for this tag’s data will be offset in the past by whatever time is entered into the cell. The units are formatted just as they are in Trend: entries of 1H, 3600S, or 60 M result in a lag of 1 hour, 3600 seconds, or 60 minutes.
Filter Min: Applies a minimum filter to tag data. If the tag falls below this limit, the model will not use any data with that timestamp.
Filter Max: Applies a maximum filter to tag data. If the tag goes above this limit, the model will not use any data with that timestamp.
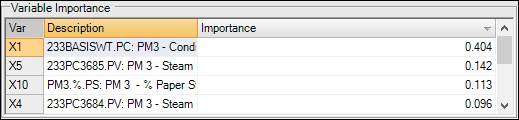
Variable Importance (PLS Only)
The Variable Importance section displays the proportion of Y variance that is explained by a variable. A high value of importance indicates that the variable has a close relationship to the Y variable.
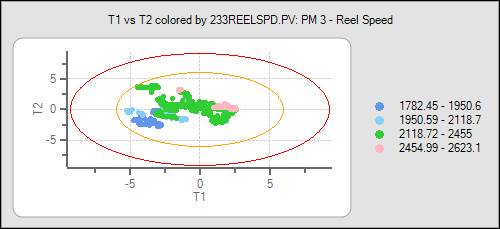
T1 vs T2
This graph displays the data projected onto the 2-d surface created by the first and second components used in the model. The units of the axes are in number of standard deviations from the component mean.
The data is colored based on the value of the variable selected in the Model Variables section. A green point is ±1 standard deviation from the variable mean. Blue tones indicate values beneath the variable mean, red tones indicate values above the variable mean. Each successively darker tone indicates a single standard deviation range. Light blue indicates 1 – 2 standard deviations below the mean, blue indicates 2-3 standard deviations beneath the mean, etc.
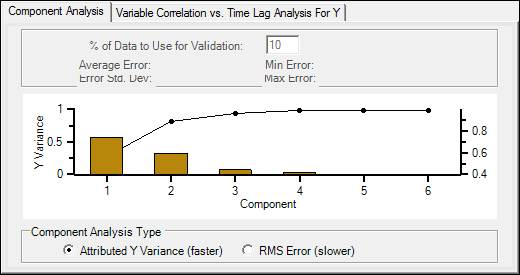
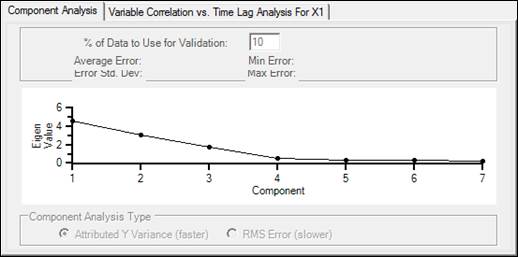
Component Analysis
The Component Analysis section displays graphical and statistical information about the model and its components. PARCmodel uses two methods to analyze possible models: Attributed Y Variance and Root Mean Square (RMS) Error.
Component Analysis Type
Attributed Y Variance: This displays the components in order from most to least important to the model. In a PLS model, the y axis is the proportion of Y variance. The bars represent the proportion of the Y-variance explained by the component. The line represents the cumulative Y-variance explained by including that many components in the model.
In a PCA model, the y axis is the eigenvalue associated with each component. It is organized so each component has successively smaller eigenvalues, referred to as a “Scree Plot”.
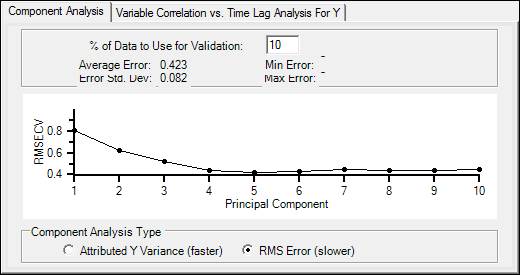
RMS Error: This option uses training sets to create a model, and then uses successively more components to predict the prediction sets. The y axis is the Root Mean Squared Error of Cross Validation (RMSECV). The lower this value, the lower the error of prediction, and the better the model.
% Data to Use for Validation (RMS Error only): The % of the data to use to test the model, called the prediction set. The remaining data will be used to build the model, called the training set. This setting is 10% by default, meaning 10 different training sets will be created and tested against 10 different prediction sets to create and evaluate the model.
Average Error: The average difference between the model and real data.
Error Std. Dev: The standard deviation of the error.
Min/Max Error: The minimum/maximum error measured during model building.
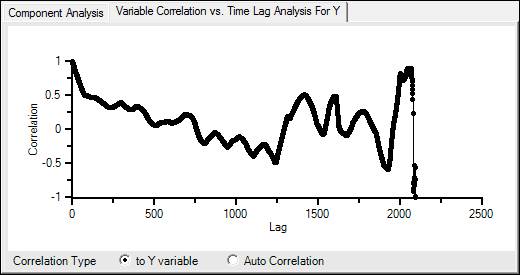
Variable Correlation vs Time Lag Analysis for Y
To Y Variable: This options runs a correlation analysis for the variable selected in the Model Variables section with the Y variable over time. A correlation of 1 indicates perfect positive correlation, a correlation of -1 indicates perfect negative correlation, and a correlation of 0 indicates no correlation.
Auto Correlation: This options runs a correlation analysis for the variable selected in the Model Variables section against itself.
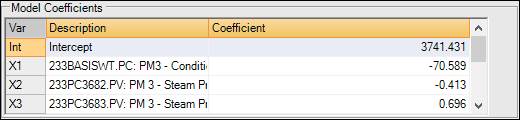
Model Coefficients (PLS Only)
The Model Coefficients section displays the coefficients and x-intercept of the linear model built by PARCmodel.