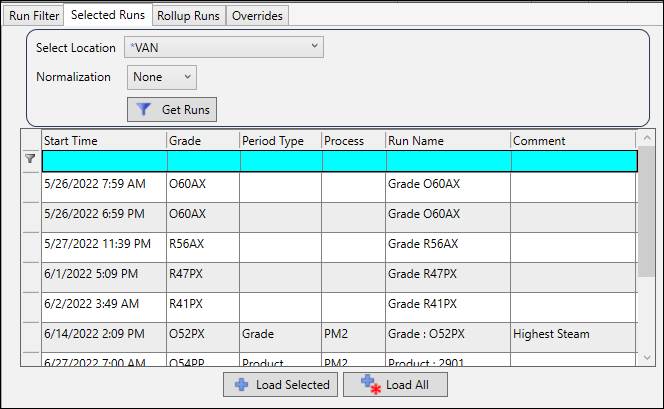
Purpose: Learn to use tag data to search for grade runs to save as selected runs.
Task: Use Run Browser to search for grade runs over a date range. Send the runs to the grid. Add a tag to the grid, then select an aggregate and sort runs by it. Choose a run and save it as a Selected Run.
Steps:
Open a Trend.
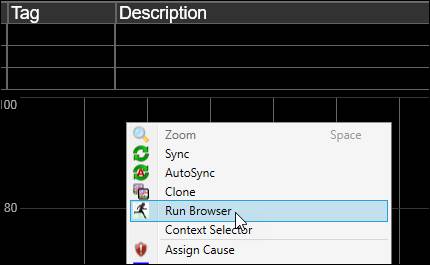
Right-click the plot area of the Trend and choose Run Browser.
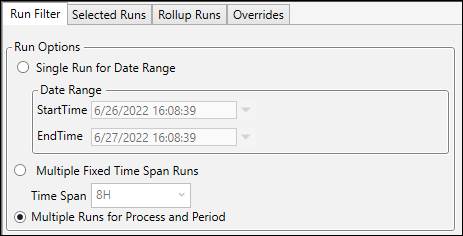
On the Run Filter tab, select Multiple Runs for Process and Period as the time period source.
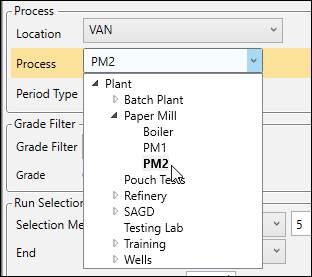
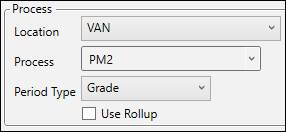
To choose a process area, use the process picker. Expand the tree as needed, then select a process area.
Change the Period Type to Grade.
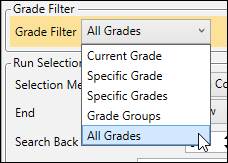
Set the Grade Filter as desired. In this example, the goal is to search for the highest use of a resource across all grades, but this exercise could be repeated for each grade individually.
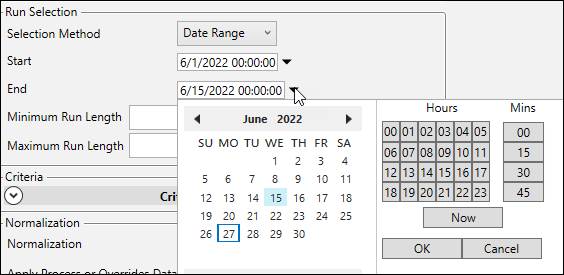
Set Filter Runs By to a Date Range. Use the calendars to set the start and end times.
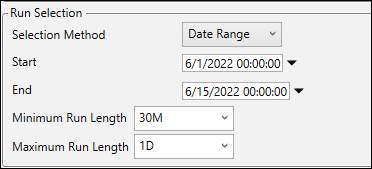
If necessary, set a minimum and/or maximum run length to remove irrelevant runs.
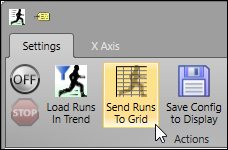
Click Send Runs To Grid.
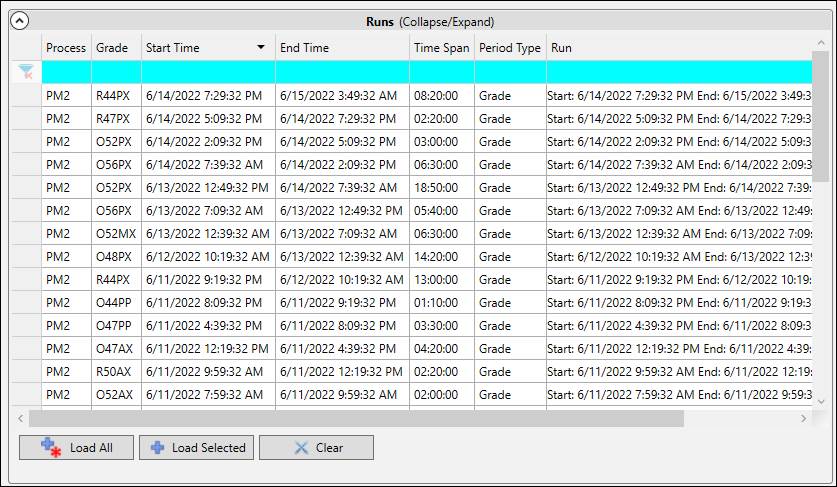
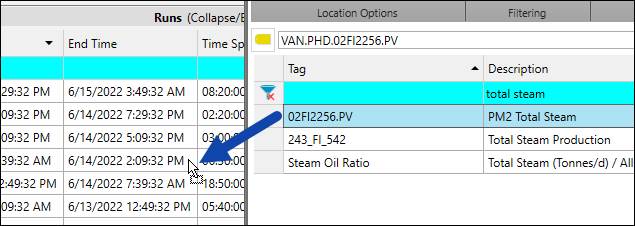
Open Tag Browser and search for a tag to use as the criteria for identifying runs. Drag the tag into the Runs Grid. (You may need to scroll to the right to see the tag column appear.)
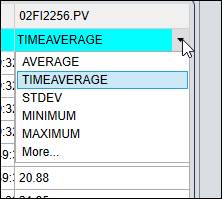
Open the drop-down menu in the filter row to change the aggregate that is shown.
Click the tag’s column header to sort by values.
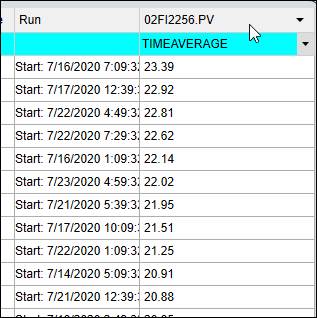
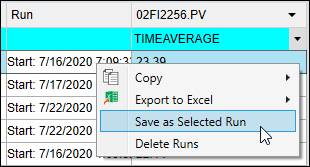
After finding the run to save, right-click the run and choose Save as Selected Run.
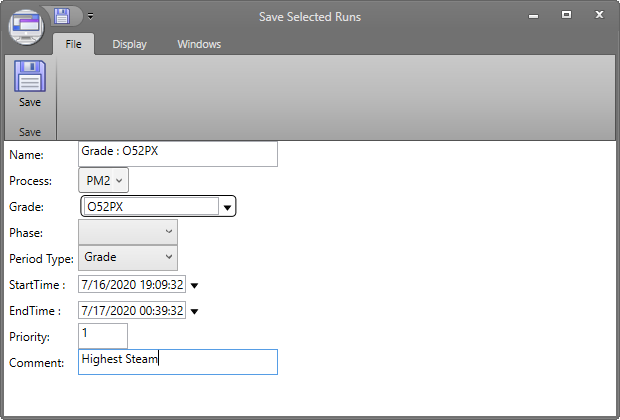
Add a Comment. Click Save.
Use the Selected Runs tab to retrieve saved Selected Runs and load them in displays.
