The Run Comparisons sheet is a variant of the normalized data sheet that shows data for multiple runs, arranged side-by-side.
To insert a profile data sheet, click the Normalized Data icon, then select Run Comparisons from the drop-down gallery.

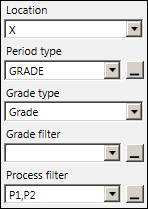
Fill out the parameters in the settings pane, much like the Normalized Sheet. Use Period type to specify what sort of runs to display. The other settings under Rollup options are optional and used to further filter which runs the sheet will display. To filter multiple processes, enter them in the Process filter box as a comma-separated list.
After applying the settings, click the Preview runs expander, then click Preview to see what runs are returned.
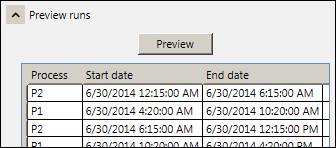
If there are too many runs displayed, adjust the start and end times or narrow the run filters as necessary.
Existing Master Tags can be dragged into row 1. If a master tag does not exist, click the Build Master Tag button to specify a mock master tag which will be valid only on this sheet.
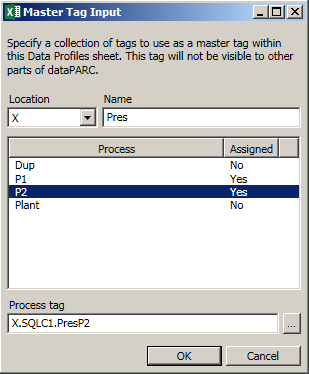
Select the tag’s location, and rename the master tag in the Name box for clarity. This name will appear in row 1 on the sheet. For each process to investigate, type or drag in a tag to assign to it. Click OK to exit the window and add the master tag to the sheet.
Calc columns can also be specified, as in the Normalized Data sheet. Unlike the normalize sheet, the master tag name of the calc (row 1) must be entered as “CALC”, in addition to setting the interpolation type to “CALC”.
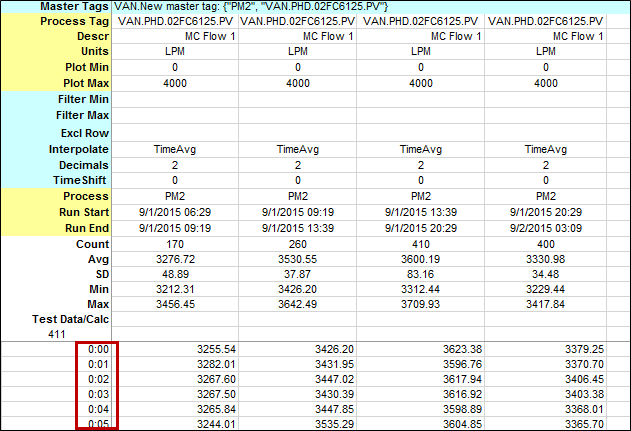
Note that the headers beside the tags function similarly to normalized sheet – the same options apply for Filter Min, Filter Max, Excl Row, Interpolate, Decimals, Test Data/Calc, and TimeShift – but some have a blue background and others yellow. The cells with blue background apply per master tag, and will be copied to all runs. The cells with yellow background apply per process tag, and will vary from run to run.
Click Get to populate data. Runs will be aligned by time in the process: e.g., all of the properties at ten minutes into each run will be in the same row.