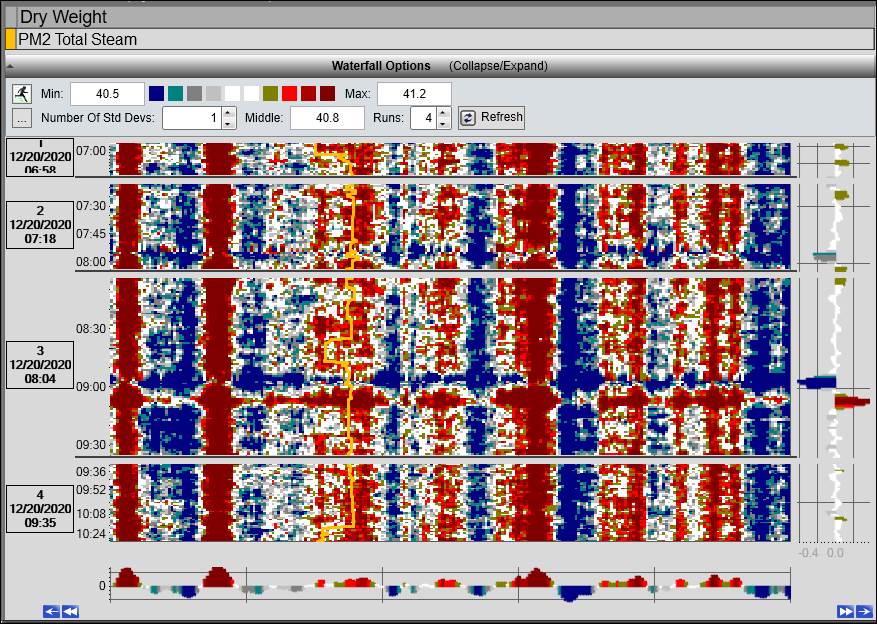
The Profile Trend plots an array of data at each timestamp, where each data point has a unique “position”. By default, the oldest data is at the top and newest data is at the bottom. The time axis is on the left, and the positions of the data increase from left to right.
The profile data is color-coded based on how the “middle” of the data is determined, whether by a setpoint tag, the average of the values at a single scan, or a grade-based target limit, and on how the difference from this middle is determined. See Waterfall Options and Configuration for more information.
Like standard Trends, Profile Trends have two time modes: single timespan and run mode.
In either mode, turn on SmartMouse or Zoom to drill into areas of interest.
Single timespan navigation
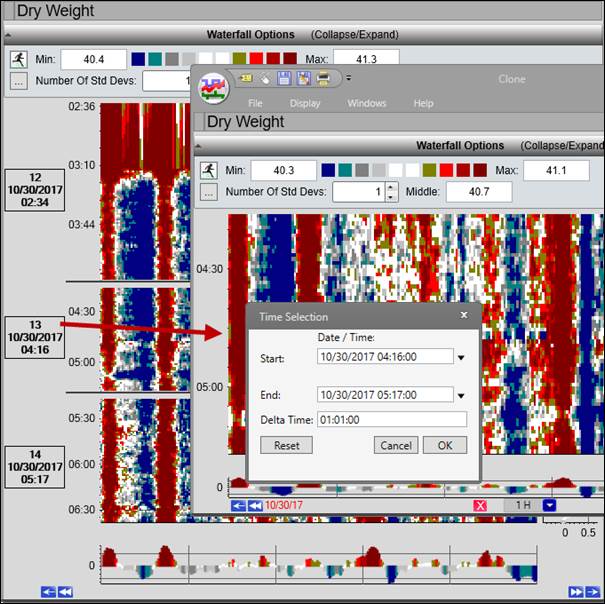
In single timespan mode, the Waterfall shows data for a continuous time period. Use the time axis (shown on the left by default) and the time navigation buttons (shown at the bottom default) to change the timespan.
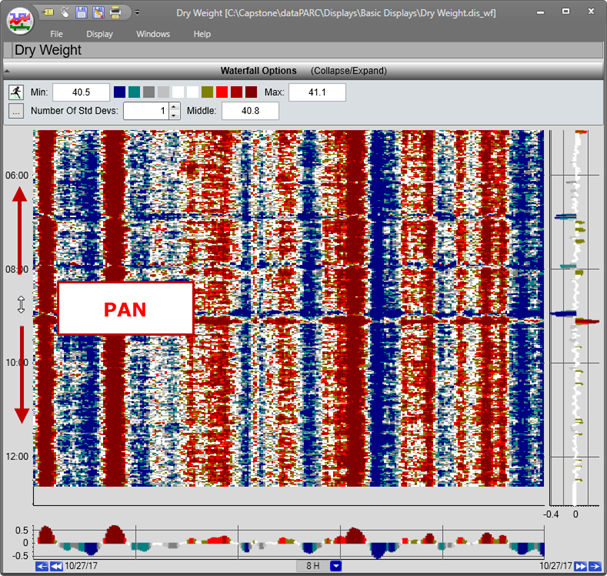
Time Axis: Click and drag to pan the profile trend.
Pan Backwards in Time: Clicking this button shifts the time of the trend back in time one time-span. For example, if the time-span is 3H and the trend displays 9:00 to 12:00, clicking this button displays 6:00 to 9:00 of the same day.
Double Timespan into Past: Clicking this button adds one time-span in the past to the trend. For example, if the time-span is 3H and the trend displays 9:00 to 12:00, clicking this button displays 6:00 to 12:00 of the same day.
Start Time and End Time: The start and end time labels are displayed on opposite sides of the axis. Clicking on the date opens a window where the date can be manually specified. If the end time of the trend is earlier than the current time, the labels will turn red.
Reset: Resets the X-Axis to the current time and the default timespan . If the end time of the trend is earlier than the current time, the button will turn red.
Undo: Undoes the last timespan change.
Time Span: The time span of the trend is shown in a text box. The time span can be changed with the drop-down arrow or typing in the box. Enter a number followed by a time key letter: S for seconds, M for minutes, H for hours, or D for days. For example, the default current span is 8H for eight hours. The following are special timespans available in the drop-down menu:
LSTM: Last month.
MTD: Month to date.
YTD: Year to date.
Zoom: A
 button will appear if part of the trend is highlighted. Clicking this button will zoom in on the selected area.
Double Timespan into Future: Clicking this button adds one time-span in the past to the trend. For example, if the time-span is 3H and the trend displays 9:00 to 12:00, clicking this button displays 12:00 to 15:00 of the same day.
Pan Forwards in Time: Clicking this button shifts the time of the trend forward in time one time-span. For example, if the time-span is 3H and the trend displays 9:00 to 12:00, clicking this button displays 12:00 to 15:00 of the same day.
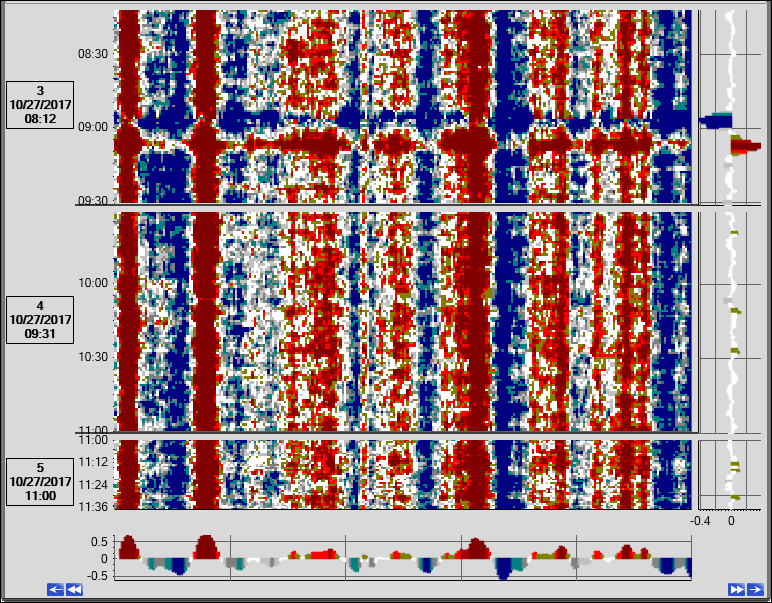
Run Mode
Rather than displaying a single continuous timespan, the Profile Trend can be subdivided into several periods of time, or “runs”. The runs can be non-consecutive. The types of time periods available include fixed time periods, like days, production weeks, etc., and process-dependent time periods, like product runs and grade runs.
Jut like in a standard Trend, use the Run Browser to enable run mode. To access the Run Browser from a Waterfall, click the Run Browser button in Waterfall Options or right-click the plot area and select Run Browser.
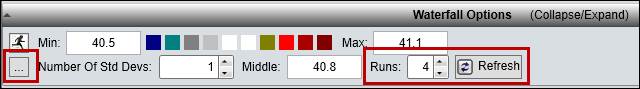
Waterfalls are typically used to look at product runs. Clicking the ellipsis button (…) in Waterfall Options will launch the Run Browser with product runs from the last 24 hours automatically loaded in the Runs Grid.
When in run mode and filtering by run count, the number of runs can be changed on the fly in Waterfall Options. Click Refresh to apply changes.
Use the time arrow buttons in run mode to add more consecutive runs or to shift the run set.
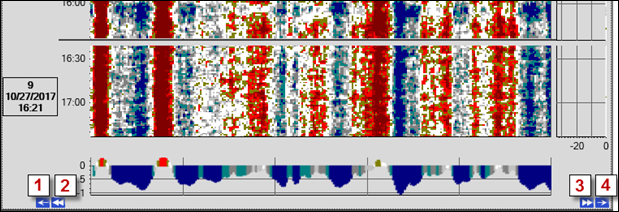
Shift Backwards: Load the run previous to the earliest run and remove the most recent run.
Add Prior Run: Add the next earliest run.
Shift Forward: Load the run after the most recent run and remove the earliest run.
Add Next Run: Add the next most recent run.
When in run mode, double-click an individual run to launch a popup trend of just that run.
Zoom
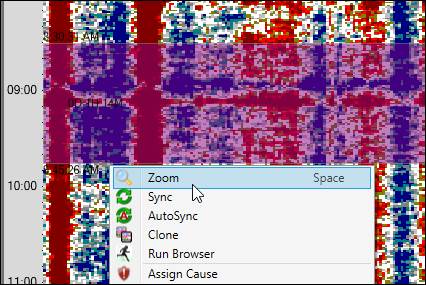
Use the Zoom feature to drill down into a period of time or value range. To zoom, click and drag across the plot area to highlight a slice of time. Click the Z time navigation button or right-click the plot area and select Zoom.
To zoom into a period of time and a value range simultaneously (X/Y Zoom), hold down the SHIFT key while clicking and dragging across the plot area.
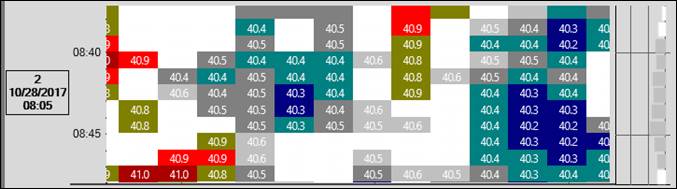
If zoomed in far enough and the Show Value Text property is enabled, the actual values at the positions will be shown on the plot.
SmartMouse
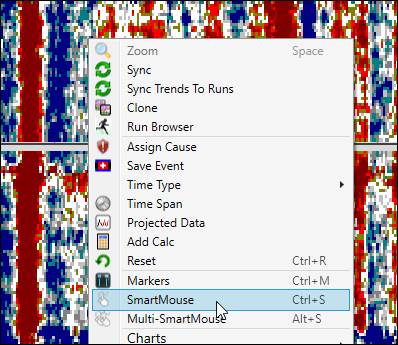
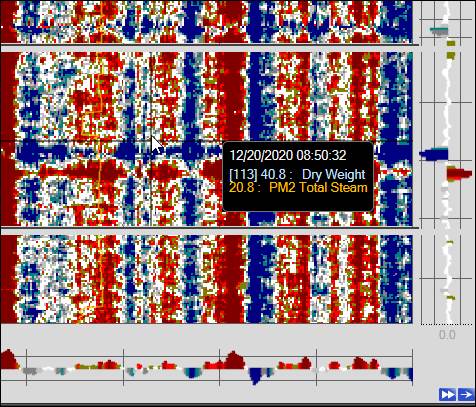
Use SmartMouse to show values and the timestamp at the position of the mouse cursor. To enable SmartMouse, right-click the plot area and select SmartMouse.
When SmartMouse is enabled, the MD and CD Charts show the actual values at the time and position of the crosshairs.
Add Non-Profile Tags
Additional non-profile tags can be shown on the profile trend. Drag and drop tags on to the plot area.
Double-click the tag in the tag info grid to launch a popup trend/clone of just that tag.
Profile Trend Right-Click Menu
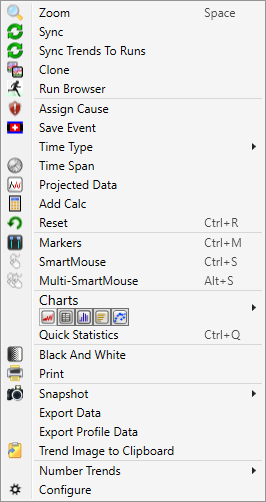
Right-click on the profile to open the menu. Waterfalls use the Trend’s context menu, with the exception of the Export Profile Data option, see below.
Export Profile Data
Profile Trends have an additional plot area context menu option “Export Profile Data” that copies all of the profile data in the trend to the clipboard, from where it can be pasted into application like Microsoft Excel. Selecting this option opens the Export Profile dialog.
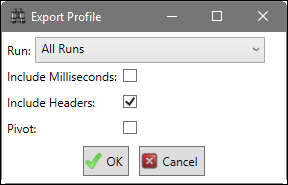
Run: Choose whether to export data from all runs or select an individual run.
Include Milliseconds: Whether to include milliseconds in time fields.
Include Headers: Whether to include run headers with run identifying information.
Pivot: Whether to pivot the data.
The “Export Data” trend context menu option only applies to profile trends if there are non-profile tags in the tag info grid.