- 01 Dec 2023
- Print
- PDF
dataPARC Performance Data Engine: PARCpde
- Updated on 01 Dec 2023
- Print
- PDF

Modern process data historians are capable of extremely high sampling rates of one second or less. While this facilitates very detailed high-frequency process analytics, it can also lead to slow performance when visualizing data over long periods of time. For instance, a single tag collected at one second intervals for one year yields over 31.5 million individual data points. Even the fastest servers and network infrastructure require significant time to provide that much information to a visualization client.
dataPARC has solved this problem with its Performance Data Engine (PARCpde). Utilizing a smart algorithm, PARCpde maintains a secondary archive with trend-optimized data that can be transferred to a client and displayed at the “speed of thought”.
PARCpde also includes custom aggregate calculation and archiving to facilitate high-speed access to statistics from specified time periods (shifts, days, etc.) or product runs (grades, lots, batches, etc.).
PARCpde Performance
Trend displays are typically the most resource-intensive type of data visualization, as they often include large numbers of tags and, in some cases, span years of operation. The example display below contains 53 tags. If the average sampling rate for all those tags is 5 seconds, and a user wanted to view one year’s worth of raw data, the trend client would need to pull 334 million individual data points from the server and render them on the display. Assuming each data point is a typical size of 10 bytes, the required data transfer would be 3.34 Gigabytes. Depending on network infrastructure, this could take a very long time and/or cause severe network congestion.
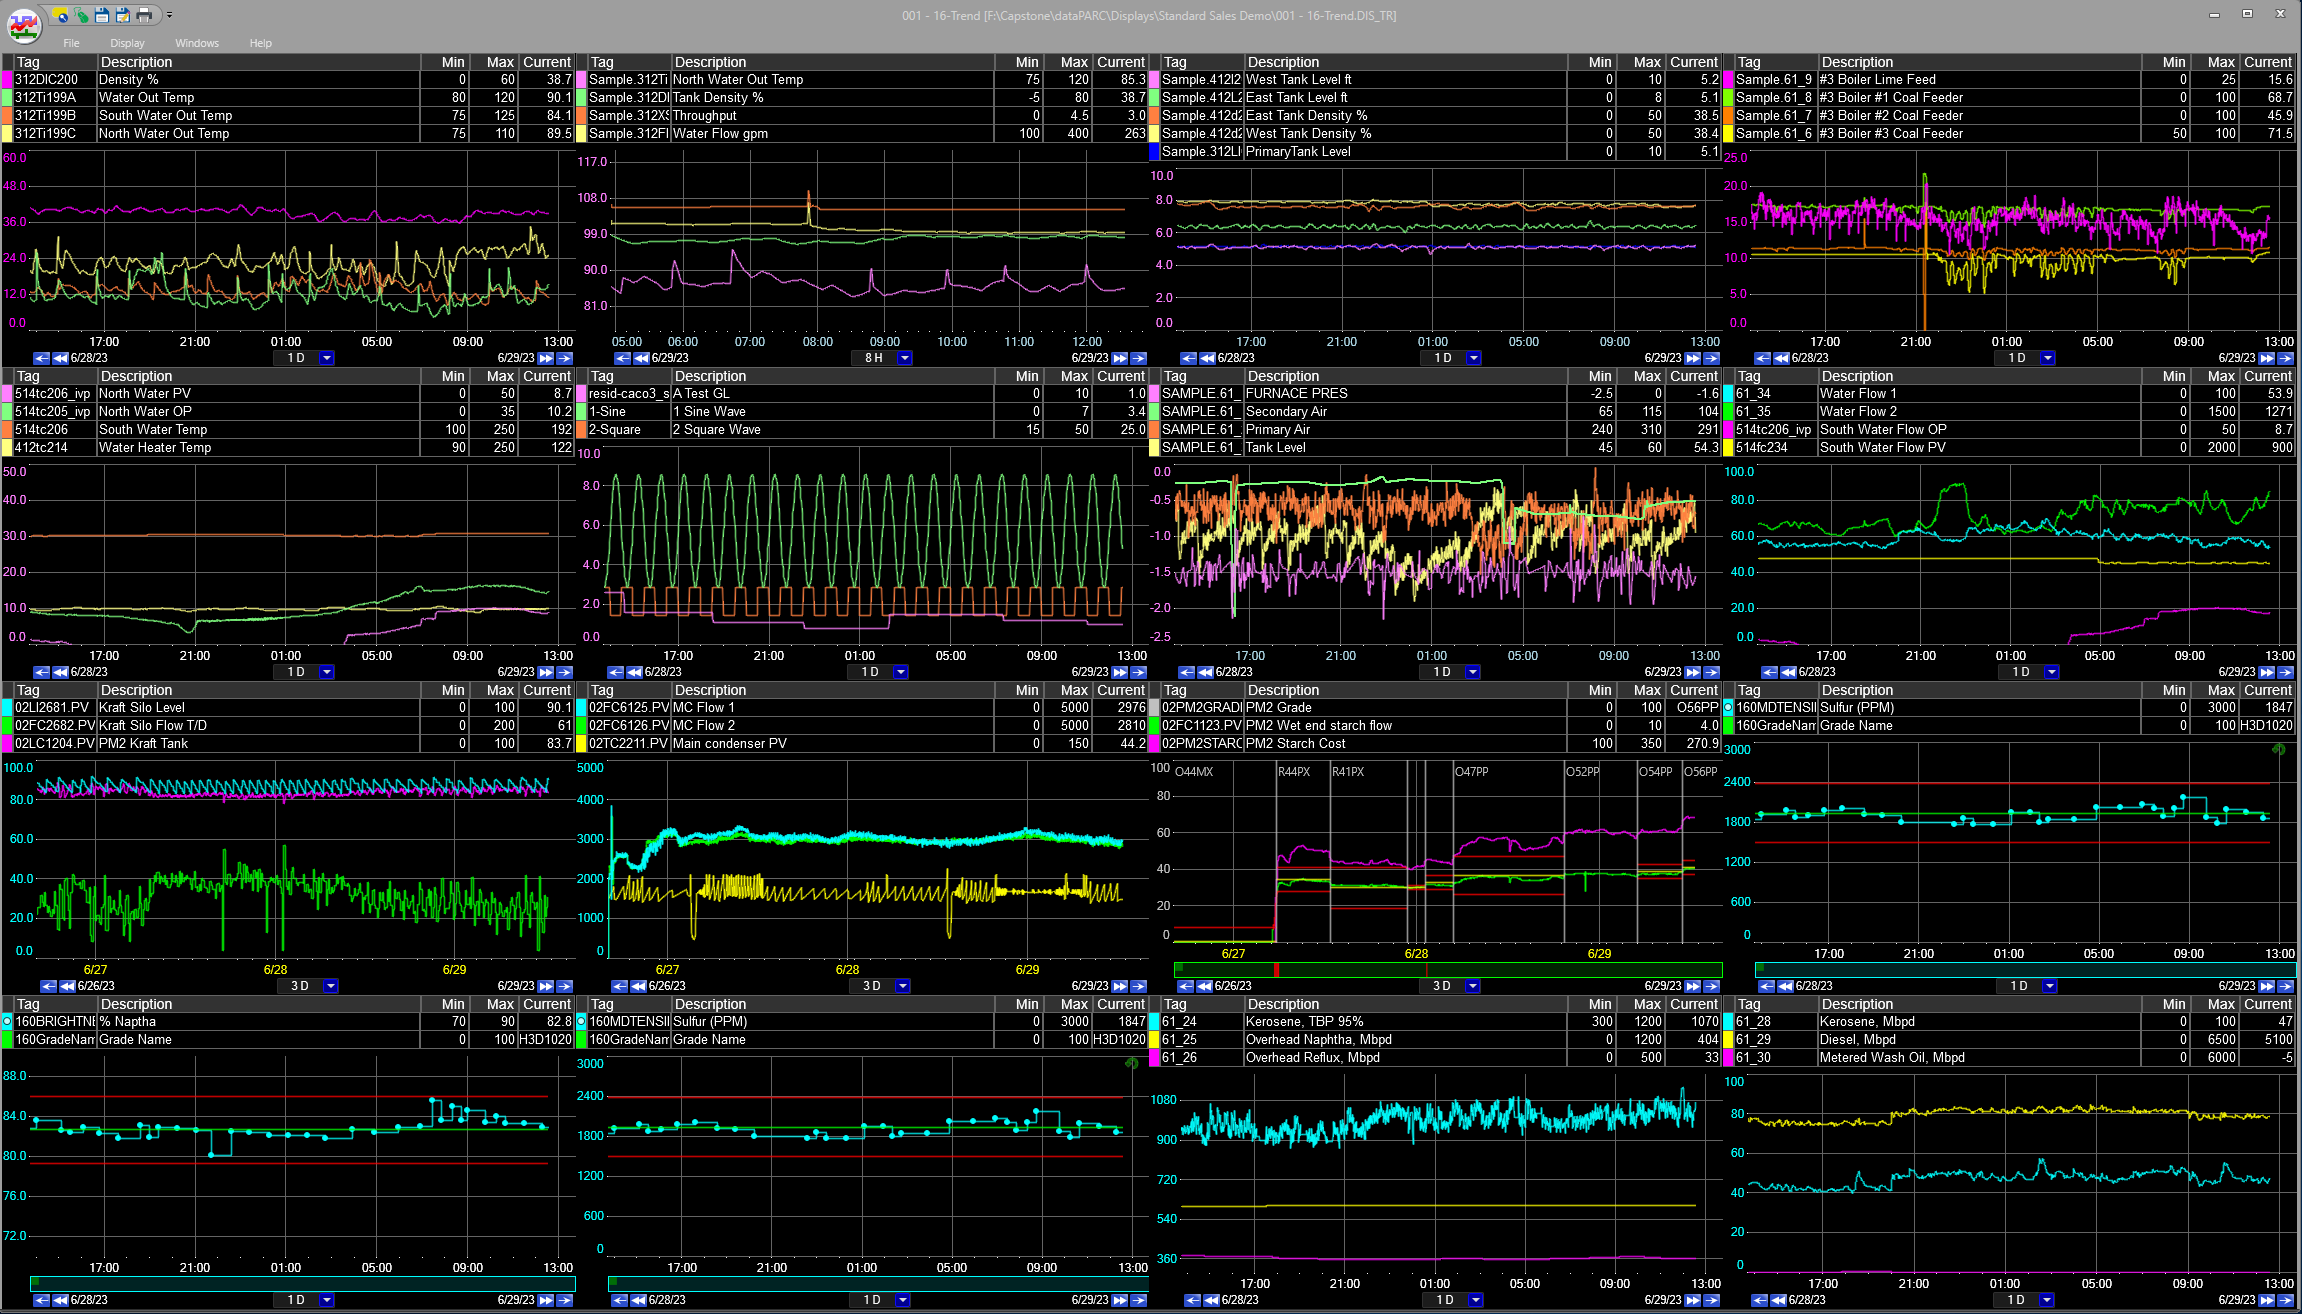
However, PARCpde provides the client with trend-optimized data that dramatically reduces the volume of data points without impacting the visual impact of the trend plots. This leads to major performance improvements, especially when considering longer trend time spans.
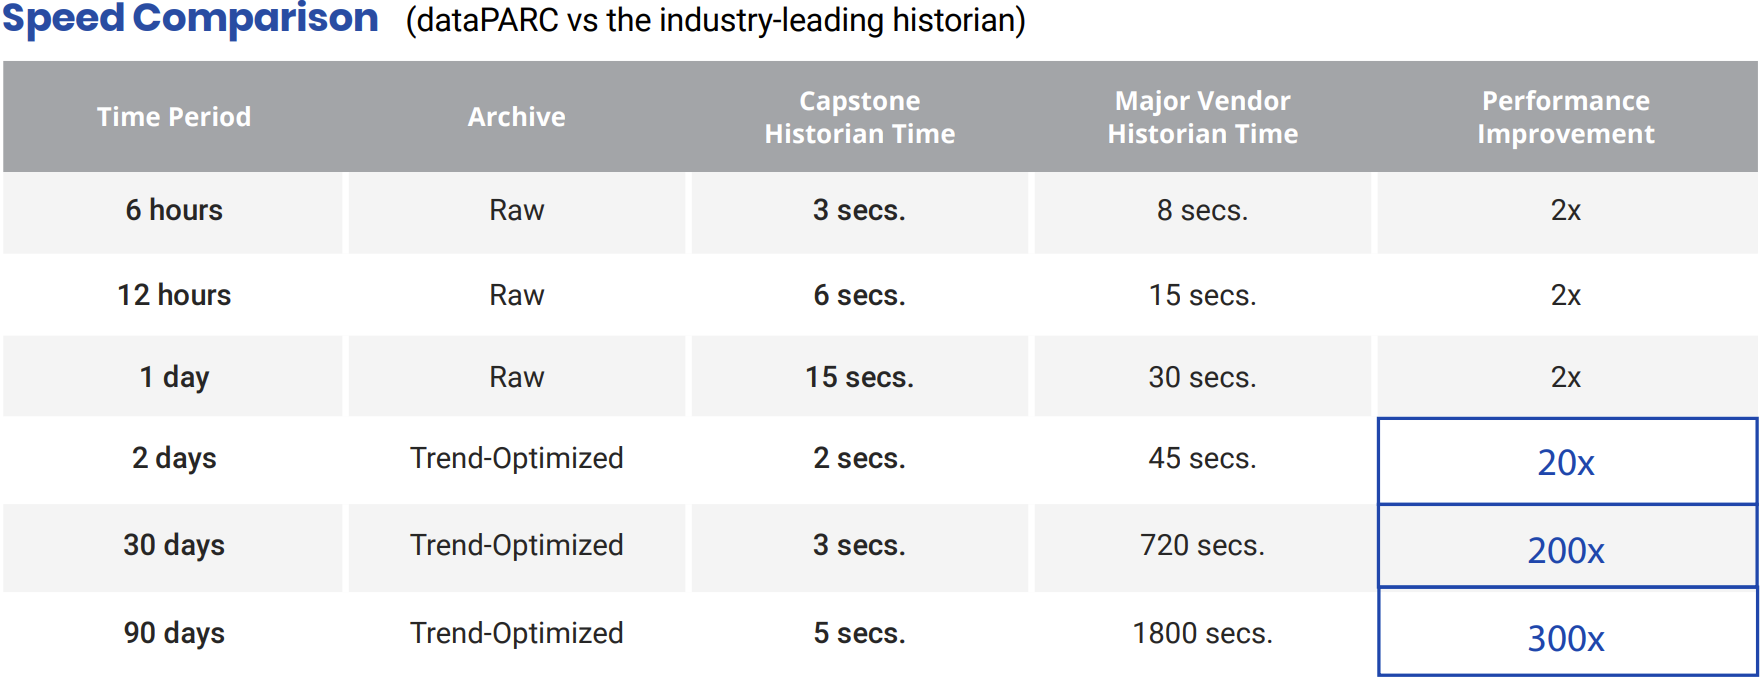
Retrieval time for custom aggregates is typically even faster, as the number of data points is small and the pre-calculated statistics are available in the secondary archive. This improves performance in trends, centerlines, and Excel Add-In data extractions.
PARCpde Architecture
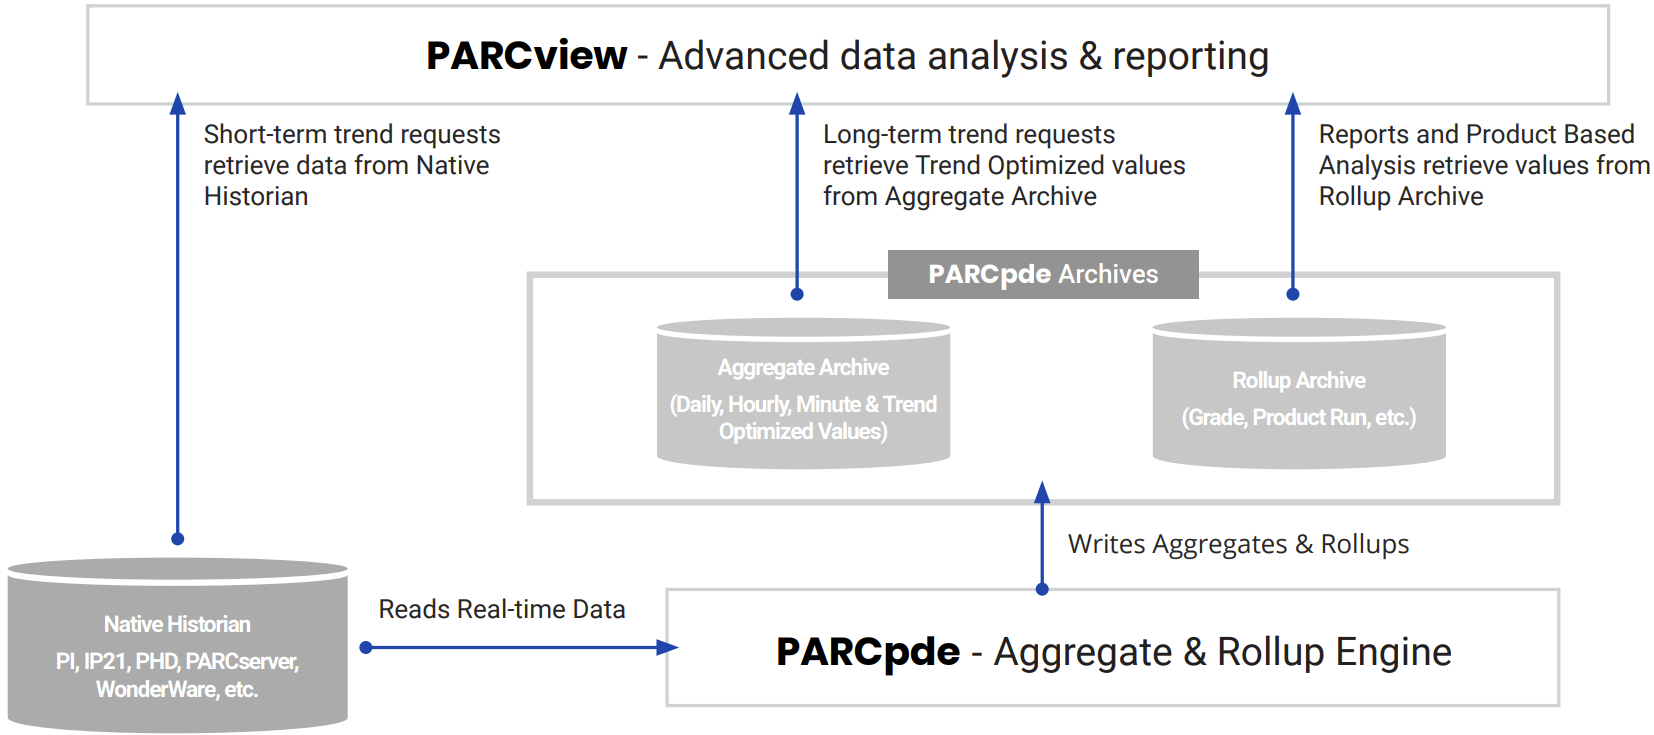
PARCpde is included as a component of the dataPARC Server applications. The Aggregate Archive service (PARCaggregate) runs on a fixed interval (typically once per hour) to create a secondary archive of trend-optimized historical data and custom aggregates. This secondary trend-optimized archive is automatically utilized to satisfy PARCview trend data requests of greater than one day time span, or when specific time types are selected. The Rollup Archive service (PARCrollup server) runs continuously to provide product run, grade, or other event-based aggregates to PARCview displays as requested.
Data Source Aggregate Configuration
Several options are available with regard to aggregates under System Configuration -> Source. For each Source, there are three sections under the OPC UA Configuration tab that allow customization of aggregate handling:
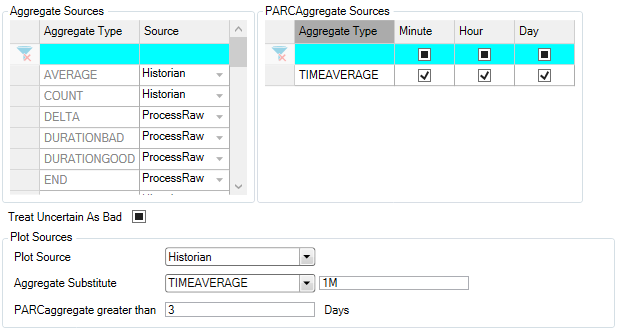
Aggregate Sources
For each aggregate type, there are two options for calculation:
Historian: If available, PARCview tools will read the pre-calculated aggregate value from the historian (typically PARCaggregate).
ProcessRaw: The aggregate will be calculated ad-hoc by the PARCview tool based on raw data.
PARCAggregate Sources
Checking these boxes configures PARCaggregate to calculate and store values for each time period.
Plot Sources
These options determine how the Trend display uses aggregates to plot data.
Plot Source:
Historian: If selected, Trend will utilize pre-calculated plot-reduced data from the source historian (if available). This includes plot-optimized data calculated by PARCaggregate.
Process Raw: If selected, Trend will calculate plot-reduced data “on-the-fly” from raw historian data. This will result in longer plot load-times.
UseAggregateSubstitute: If selected, Trend will use an alternative aggregate instead of plot-optimized data, as specified in the fields below.
Aggregate Substitute: Specify the type and time period of aggregate to be plotted if “UseAggregateSubstitute” is selected above. This requires the selected aggregate to be configured in PARCaggregate.
PARCaggregate greater than: When timespan of a Trend is greater than this number of days, use PARCaggregate plot reduction. This only applies when “Historian” plot source is selected above.
PARCaggregate service
The PARCaggregate service calculates plot-optimized data sets from raw historical data. It can also produce daily, hourly, and/or minute aggregate data. Calculations and archiving are run once per day at a specified time.
Important notes
PARCaggregate works with the dataPARC historian or any other data source using a .NET data series, including: PI, PHD, and SQL sources.
However, it will only process tags that exist in the ctc_processtags table, so PARCtagSync must also be running for any non-dataPARC Historian sources to make sure all tags are included.
Console
The main PARCaggregate console view shows a grid of sources configured for aggregate calculation:

Source Configuration
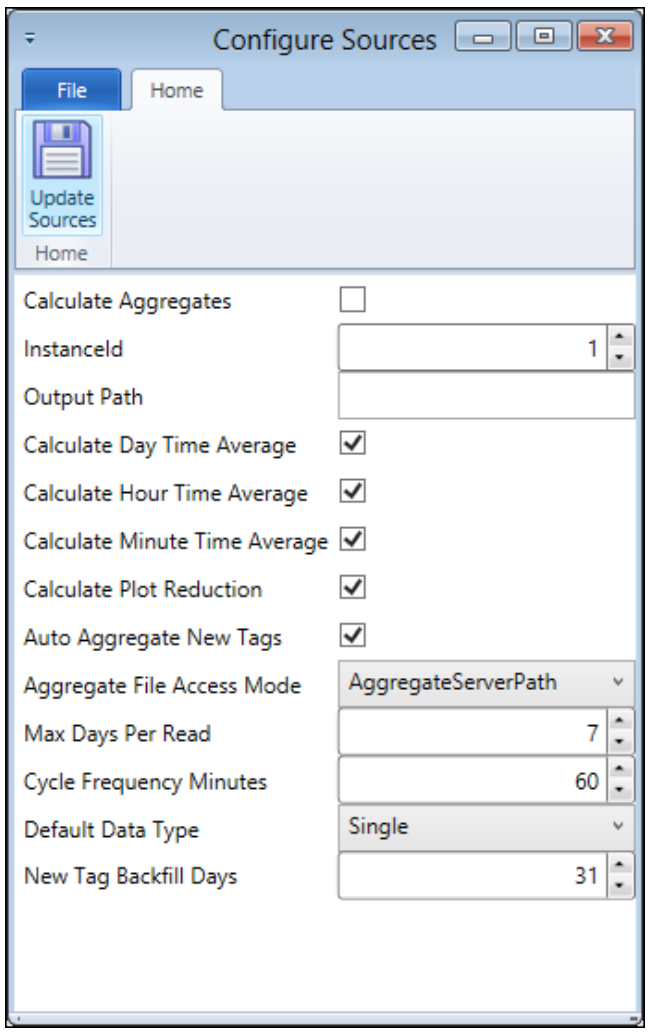
Each dataPARC source can be configured independently within PARCaggregate
The list of options is shown below. Note that “Calculate Plot Reduction” should be selected for PARCpde implementation.
Source Tag Configuration
Within each source, PARCaggregate may be configured for each individual tag.
Configuration File Settings
Each instance of PARCaggregate utilizes a configuration file.
This file specifies the instance number, delay after midnight for daily aggregate calculation, and maximum number of concurrent source aggregation calculations.
PARCrollup service
Aggregate statistics for grades, product runs, or other variable-time periods are calculated and archived by the PARCrollup service. These calculations are performed as the events are completed so that statistics are immediately available (as opposed to PARCaggregate’s periodic executions).
Console
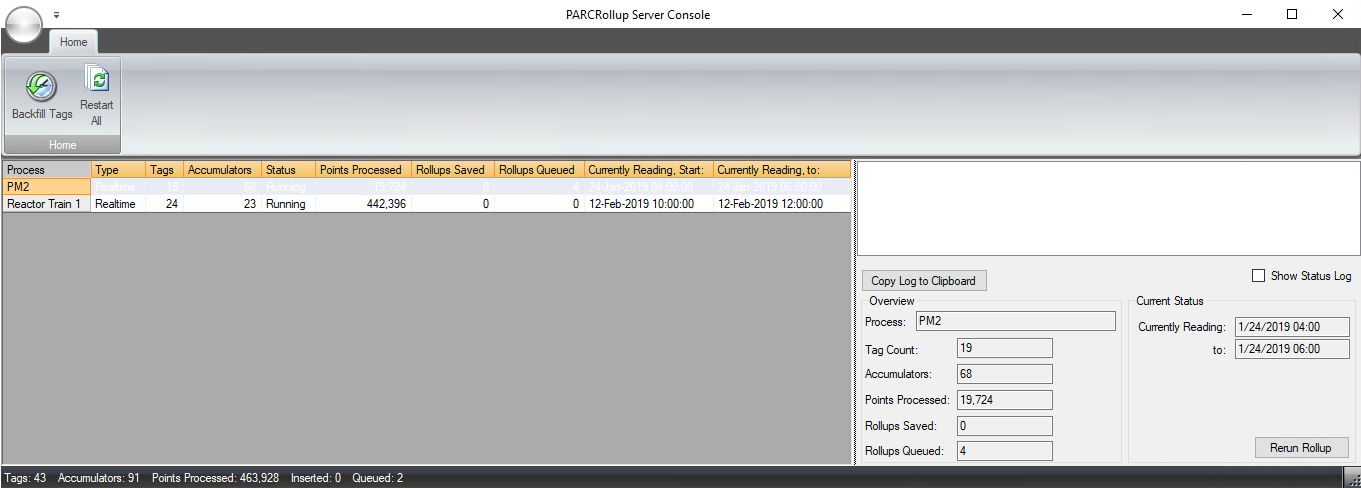
PARCrollup Server’s console provides a list of Process Areas configured for rollup calculations, and indication regarding the status of each.
Important notes
Rollup Tag Switches work with the dataPARC historian or any other data source using a .NET data series, including: PI, PHD, and SQL sources.
A tool is provided in the dataPARC Excel Add-In to build Rollup Tags, which adds a tag switch to the UTag.
Leveraging PARCpde
Using PARCpde in trend displays is very easy; plot-optimized data is typically set as the default method for any tag added to a trend. However, there are several other methods to leverage PARCpde within dataPARC tools:
Trend Right-click menu “Time Type”
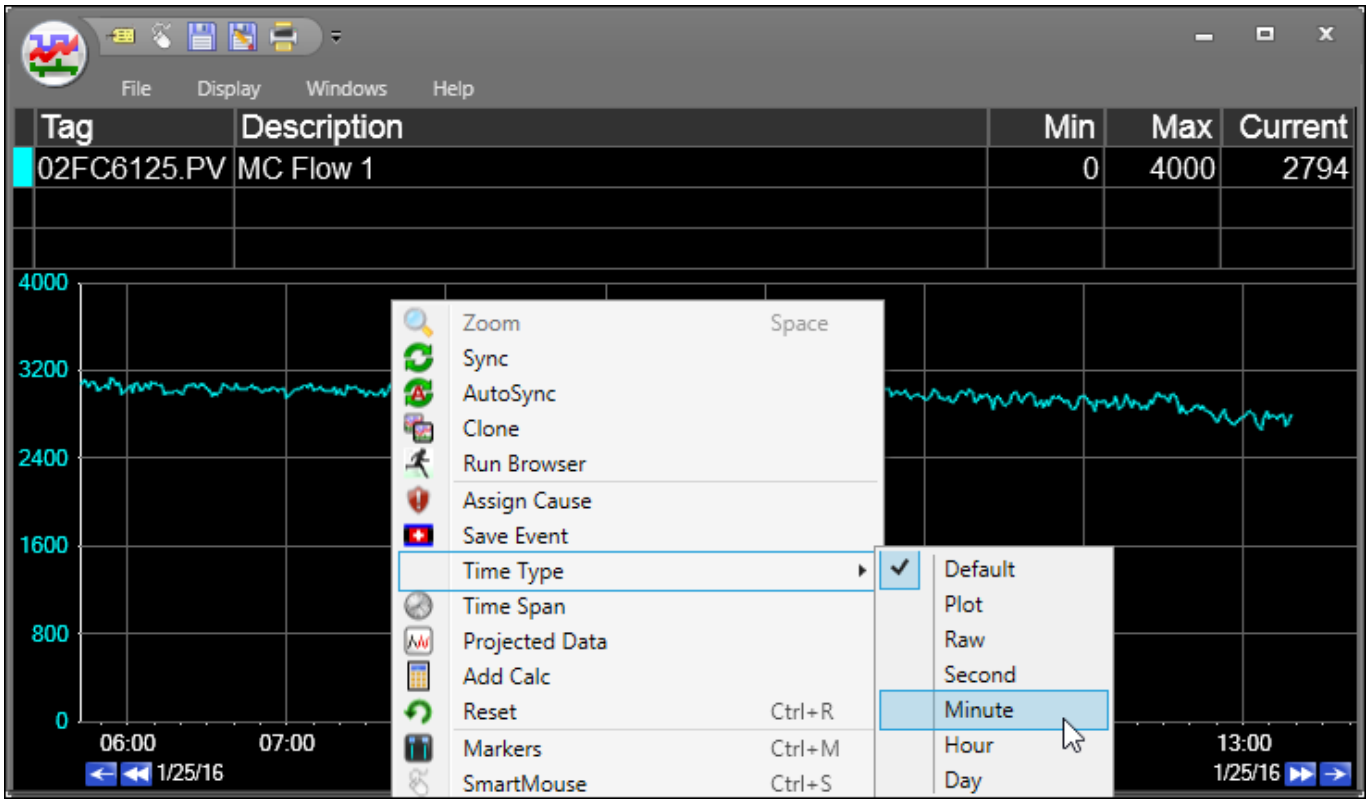
Right-clicking in a trend area will generate the menu below.
Hover over “Time Type”, then select the desired aggregate type.
Note that selecting the “Plot” type will leverage plot-optimized data, activating PARCpde.
Selecting the “Raw” type will force the trend to plot all data points from the historian, and may cause slower performance.
Tag Switches
Tag switches can be typed directly into the UTag name field on a trend display
Use a forward slash “/” followed by the desired time type. List of time type switches:
/PLOT - Instructs Trend to return plot-reduced data set for tag. Automatically applied when a tag is added to a trend.
/RAW - Instructs Trend to return raw data for a tag. Same result as removing /PLOT from a tag.
/DAY - Returns a time-weighted average calculated from 12:00 AM to 12:00 PM, not including the end time.
/HOUR - Returns a time-weighted average calculated from the beginning of the hour (1:00, 2:00, etc.) to the end of the hour, not including the end time.
/MINUTE - Returns a time-weighted average calculated from the beginning of the minute to the end of the minute (5:45-5:46, etc.), not including the end time.
/SECOND - Returns a time-weighted average calculated from the beginning of the second to the end of the second (5:45:07-5:45:08, etc.), not including the end time.
/ROLLUP(“Aggregate”, “Period”, “Grade”, “RunSourceUTag”) – Returns aggregate data from PARCrollup archive. Each argument in quotations must be entered (except RunSourceUTag, which is optional). Tag switch must be added to the tag using the tool in the Excel Add-In.
Rollups in Centerline
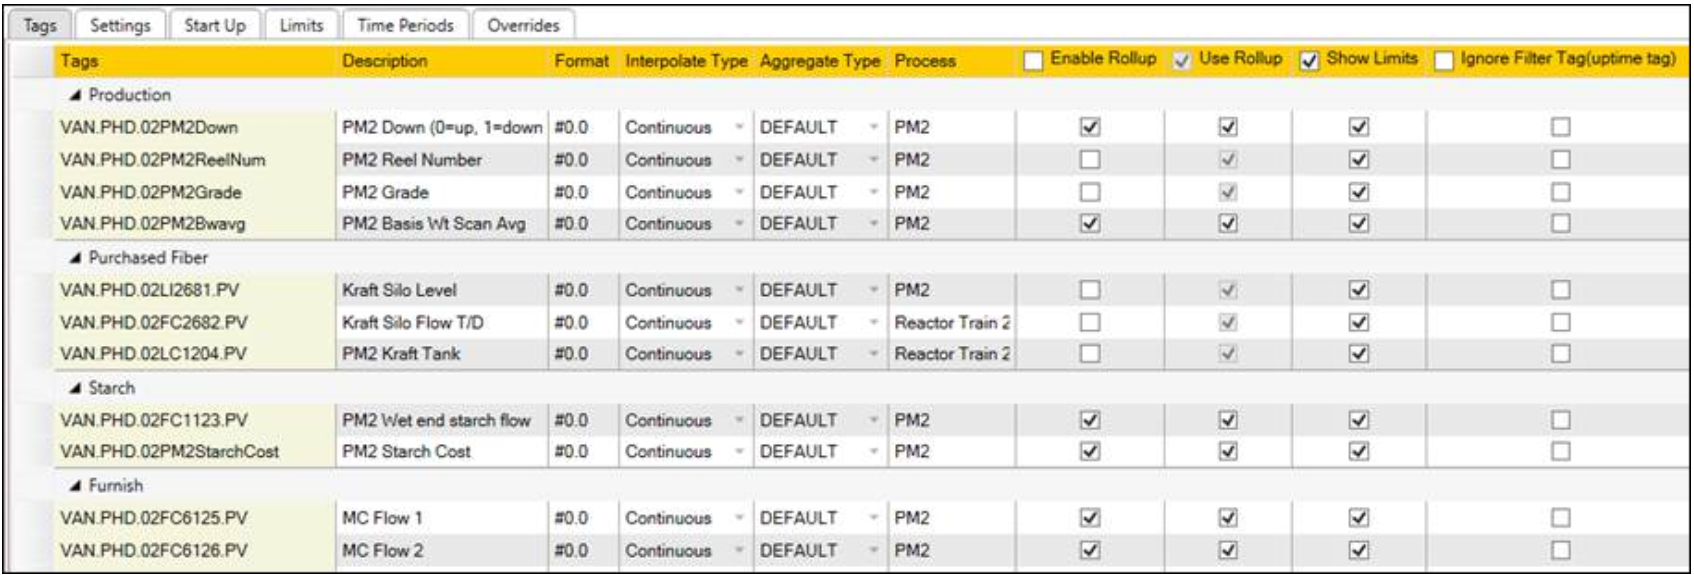
Centerline performance can be optimized by configuring displays to use Rollup data. Check the box for each tag in the “Tags” tab of the Centerline Configuration view.
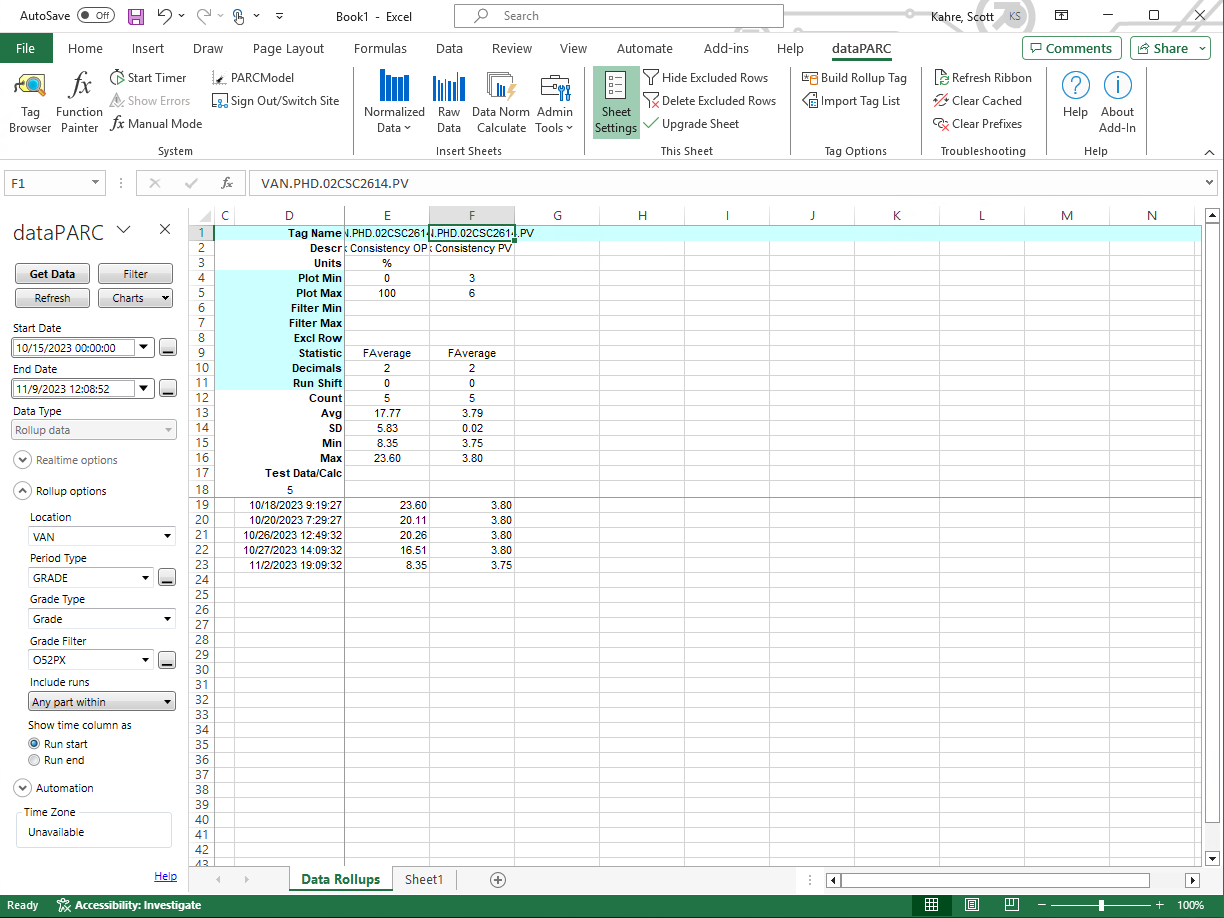
Excel Add-In Rollup Data Sheet
A Rollup Data sheet is provided in the Excel Add-In for retrieving Rollup Server aggregates.
Configuration options are available on the left pane.
Important Notes
All time types except /PLOT and /RAW require that the source/tag is configured for the desired aggregate calculation in PARCaggregate. Attempting to use a time type for which no aggregates are calculated will result in blank trends.
Quick Statistics in trends are typically calculated using the currently-displayed time type. Thus, some minor differences may exist between Quick Statistics values and those based on raw data.
PARCpde Trend-Optimized Algorithm
PARCpde utilizes an efficient algorithm for reducing data for optimized plotting. For each 5-minute period, the first, last, maximum and minimum value for each tag is recorded, and a fifth value is recorded to ensure that the 5-minute average is equal to the raw 5-minute average. All five of these points are plotted at the same timestamp on the trend display. When viewing a time span of one day or more, this creates a trend that visually appears identical to one plotted using raw data.
The examples below show raw historian data on the left, and trend-optimized data on the right. Note that while the plots are virtually identical, the data point count is much different at longer time spans.
.png)
.png)
.png)

