File
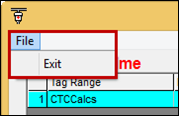
Exit: Closes the window.
Source Grid
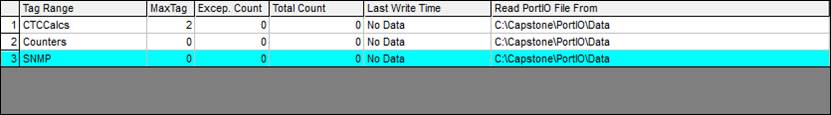
Tag Range: The name of the source.
MaxTag: The maximum dsparam ID of the tags in that range, normally total tag count if tags have not been deleted from this source.
Excep. Count: The number of points that were updated in the last cycle.
Total Count: The number of data points historized for that source since PARChistory was last started.
Last Write Time: The last time that PARChistory wrote to history for this source.
Read PortIO File From: The location that PARChistory expects to find the PortIO exception files for each source. This location is the DataPath column in the Source tab in the System Configuration of PARCview for CTC type sources.
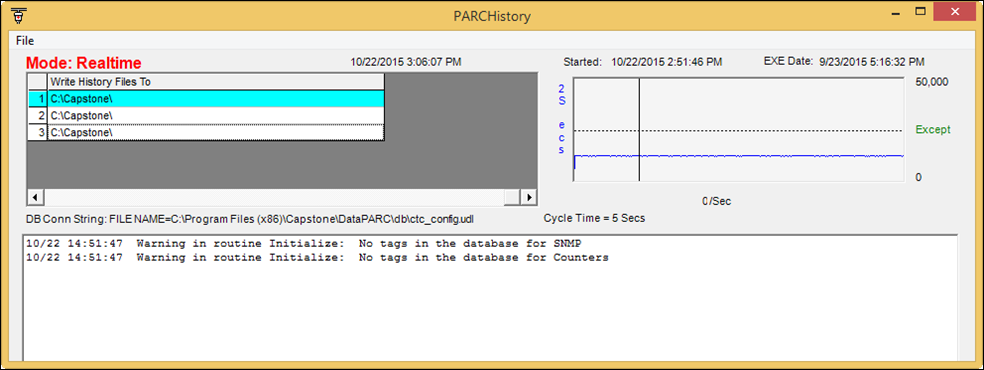
Write History Files To: The location that PARChistory writes the history files for each source. This location is the HistoryPath column in the Source tab in the System Configuration of PARCview for CTC type sources.
PARChistory Graph
The graphs provide some information on the load on PARChistory over time. The blue line is how long it taking compared to zero loads. Flat lined at ¼ of the screen means it taking a normal cycle time of 500 milliseconds. The whole range could spike up to 2000 milliseconds or 2 seconds.
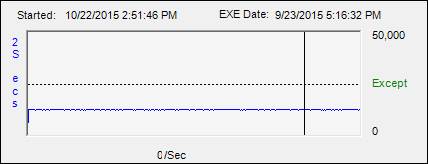
If this is spiking up PARChistory might be taking a large CPU load hit at that time or another process is taking up the CPU and causing a longer than normal cycle time. Check total CPU load or total Memory to see if the server is CPU limited or if it is memory limited and needs to page to perform its tasks.
The green line is the number of total values written to history files per cycle up to 50,000 points. There should always be a little background spiking as PARChistory reads and historizes data. Larger spikes will be seen if PARChistory was shut down for a while; network access problems prevented PortIO from writing files for a while and a large exception files is read; or process fluctuations caused more points to be written to history.
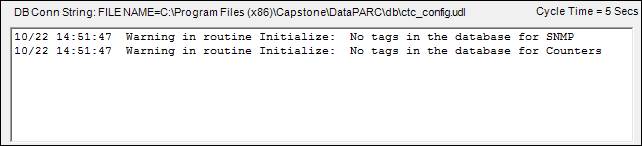
The third region in the above diagram is the status log window. Informational messages, as well as errors, will be written to this window.
Status Log Field
The Status Log field displays informational messages, as well as errors.