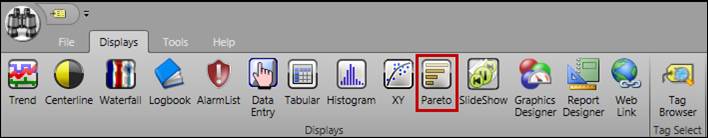
Open a new Pareto Chart from the Displays ribbon of PARCview Explorer.
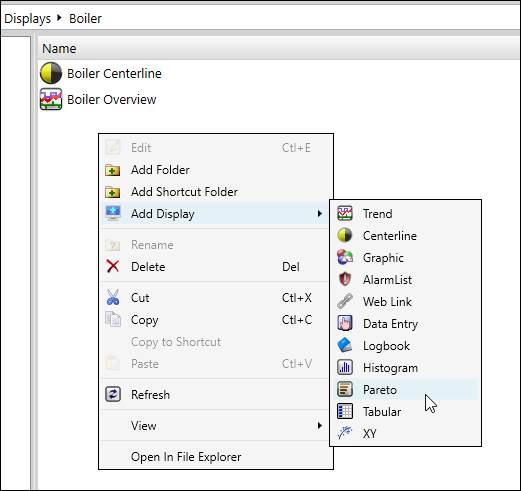
Alternatively, right-click the file pane and select Add Display > Pareto.
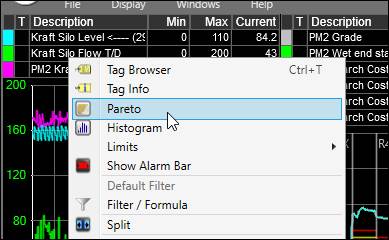
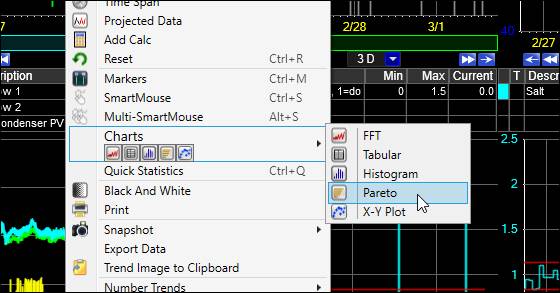
Pareto charts can also be created directly from a Trend. Right-click a tag in the tag grid and select Pareto, or right-click the plot area and select Charts > Pareto.