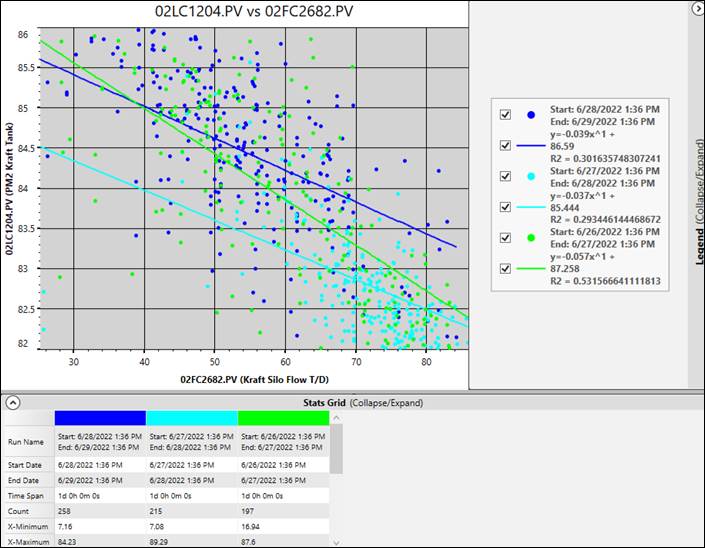
By default X/Y charts show data for a single time span, but with Run Browser data for multiple time spans can be shown. In this mode, the data is color-coded to distinguish the time spans. The Legend correlates the runs to the plotted data, and the Stats Grid shows the individual run stats.