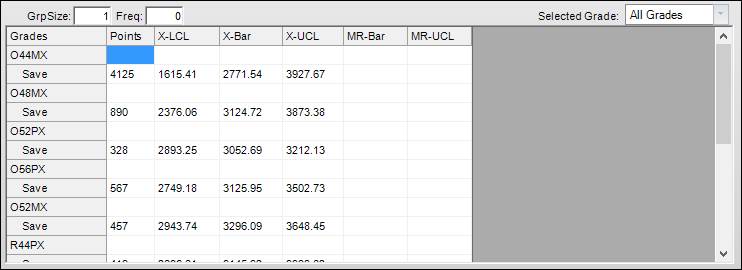
The limits table groups the data by grades and displays the calculated limits for each group. In each group, the number of points and statistical data is displayed. This table is populated by clicking the Calc Limits button in the ribbon.

Grid Settings
GrpSize: If a moving range group size was given in the SQC Configuration for a tag in SQC Configuration, it will be shown here. If not, a default of 1 is used, no grouping.
Freq: If a moving range frequency (time) was given in the SQC Configuration for a tag in Tag Limits, it will be shown here.
Selected Grade: The grade for which limits are calculated. A specific grade can be selected. By default, “All Grades” are selected.
Grid
Grades: The name of the grade.
Points: The number of data points that occur during the grade period.
X-LCL: Two standard deviations below the mean. The lower control limit.
X-Bar: The mean of the data. This value is used as the Target for the control limit.
X-UCL: Two standard deviations above the mean. The upper control limit.
MR-Bar: The average of the moving range. This is calculated if a group size or frequency is chosen in the SQC Configuration for a tag in Tag Limits.
MR-UCL: The upper limit of the moving range variability calculated as 2 standard deviations above the average variability. This is calculated if a group size or frequency is chosen in the SQC Configuration for a tag in Tag Limits.