Plot Area
- 01 Feb 2024
- 印刷する
- PDF
Plot Area
- 更新日 01 Feb 2024
- 印刷する
- PDF
The content is currently unavailable in Ja - 日本語. You are viewing the default English version.
記事の要約
この要約は役に立ちましたか?
ご意見ありがとうございます
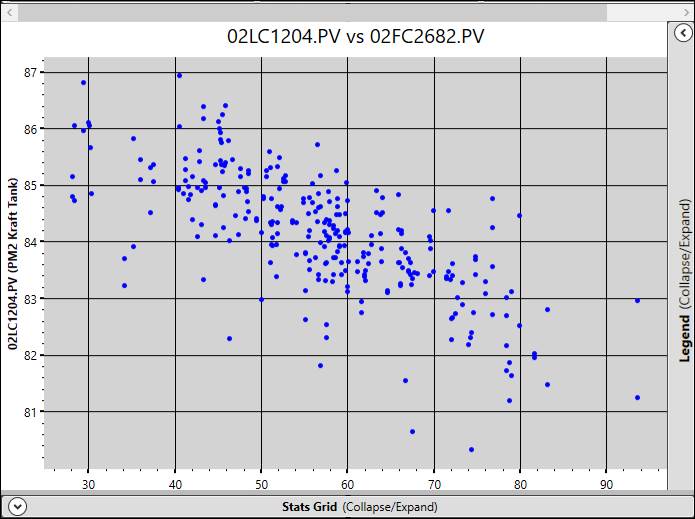
The plot area shows the scatter plot of the data. By default for new charts, the data shown is for the last 24 hours and is normalized to a step size of 5 minutes. Use Run Browser to change the timespan and normalization settings.

この記事は役に立ちましたか?

