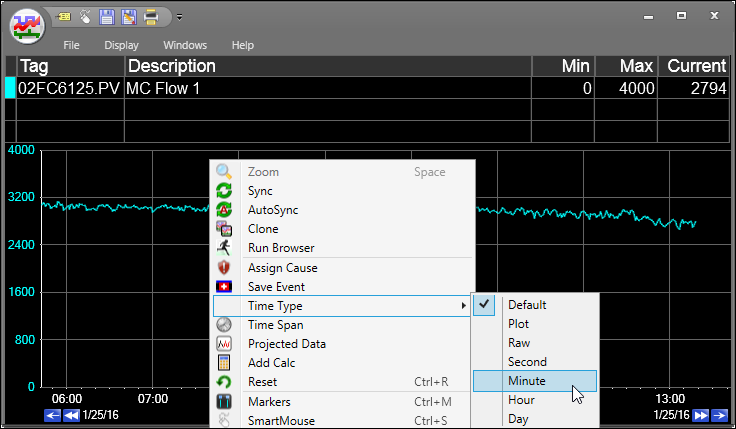
Right click on a trend’s plot area and select Time Type then the desired option. If these time types are configured to use PARCaggregate values, the PARCaggregate data will be displayed in the trend.
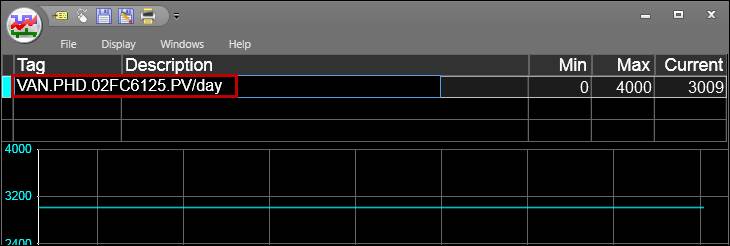
Alternatively, use Tag Switches to view daily, hourly, or minute averages of a tag. These are be used on an ad-hoc basis on a trend by adding the switch to the UTag name.